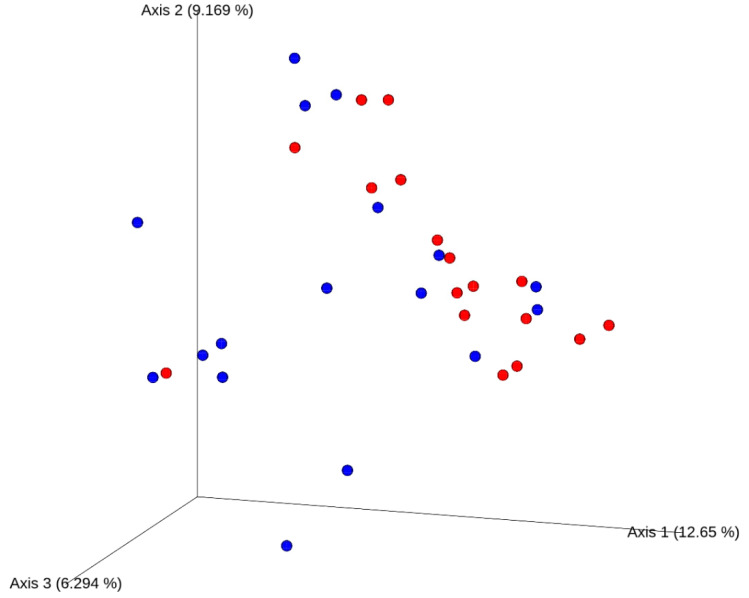
Figure 6.
Principal coordinates analysis (PCoA) plot of the unweighted UniFrac distances from baseline stool samples of healthy male participants (n = 34). High-trimethylamine-N-oxide (TMAO) producers in red (n = 17; those with ≥40% urinary TMAO increase from 0 min study-baseline in response to choline bitartrate) and low-TMAO producers in blue (n = 17; those with <40% urinary TMAO increase from 0 min study-baseline in response to choline bitartrate) were significantly different from each other (Permutational multivariate analysis of variance, PERMANOVA p = 0.01, R2 = 0.05 with 999 permutations using the Adonis function).

