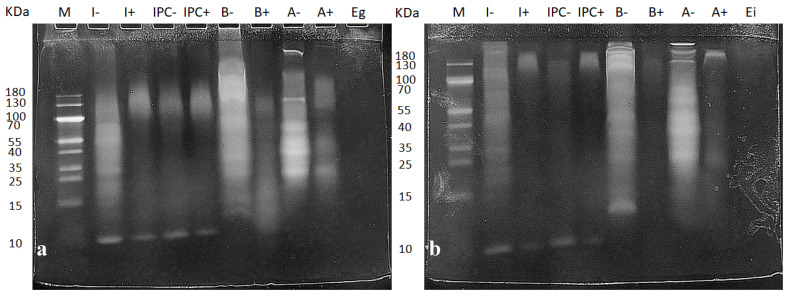
Figure 1.
Protein hydrolysis of food after gastric (a) and intestinal (b) digestion. Samples marked with “+” are the digested ones and the samples marked with “−” are the negative controls for each digestion. The protein load was adjusted to 30 μg of protein in each lane, except for the enzyme controls, which were used without dilution. A molecular weight marker (10–180 kDa) was included. I, insect; IPC, insect powder concentrate; B, beef; A, almond; Eg, gastric enzyme control; Ei, intestinal enzyme control; M, molecular weight marker.

