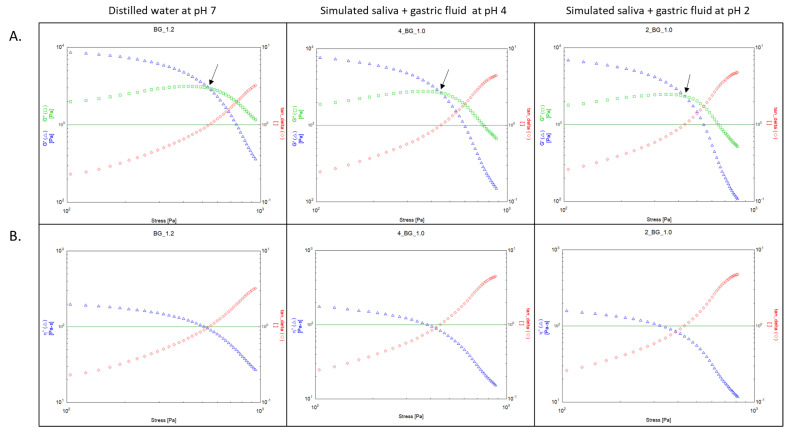
Figure 2.
An example of pseudoplastic rheological behaviour observed in beta-glucan. Graphs show (A) rheological yield points (top half, y-axis left: G’ and G” in Pa, y-axis right: Tan (δ), x-axis bottom: shear stress in Pa) and (B) complex viscosity (bottom half, y-axis left: η* in Pa.s, y-axis right: Tan (δ), x-axis bottom: shear stress in Pa) plots as shear stress is gradually increased in distilled water (pH 7), simulated digestions with SDF-PPI (simulated digestion fluid proton pump inhibitor at pH 4) and SDF (simulated digestion fluid at pH 2). The black arrow in each plot indicates the yield point where Tan (δ) = 1. Note that the rheological behaviour does not change under chemically simulated digestion.

