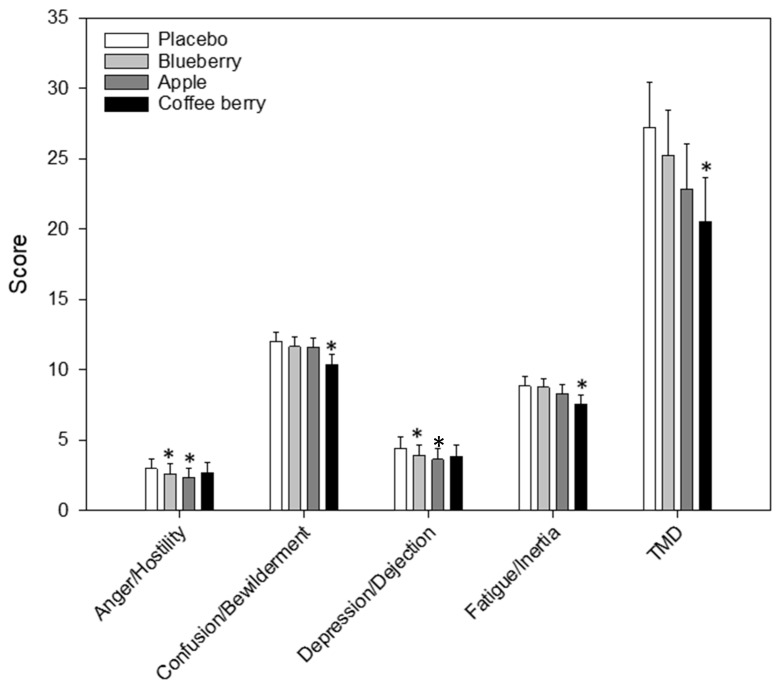
Figure 3.
Profile of mood states. Values are adjusted means ± SEM derived from the linear mixed model using untransformed data (n = 32). Treatment and time (60, 180, 360 min) and their interaction, i.e., treatment x time were entered into the model as fixed effects. Respective pre-dose scores (baseline assessment) were also entered into the model as a covariate and subject was included as a random effect. Effects were calculated using log-transformed data. Post-hoc comparisons were made between placebo and each of the active treatments using a Bonferroni adjustment for multiple comparisons. *, p < 0.05 (post-hoc test against placebo).

