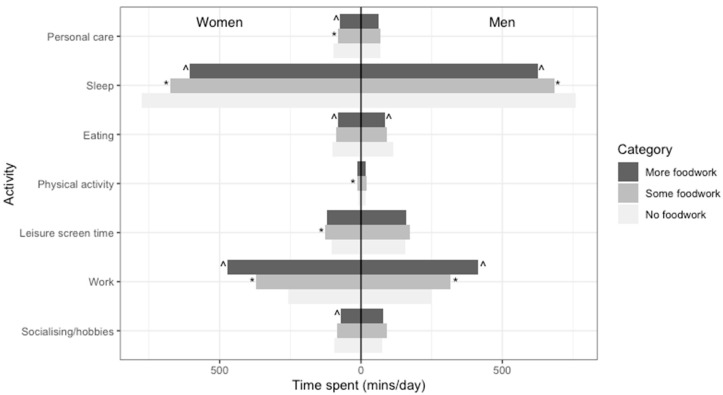
Figure 2.
Model-adjusted a compositional means for men and women by foodwork category (n = 6143) a Adjusted for age, gender, employment status, education, occupation, presence of children, and diary day type. ^ Statistically significant log-ratio difference between more and some foodwork for this part. * Statistically significant log-ratio difference between some and no foodwork for this part.

