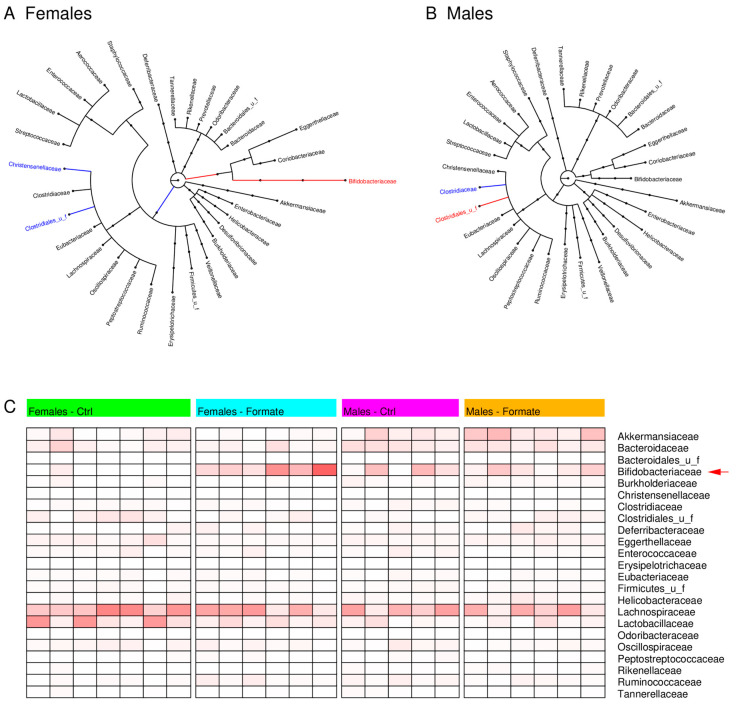
Figure 4.
(A,B) Phylogenetic tree of the identified microbiota truncated at the family level, from the stools of female (A) and male (B) mice. The longer the edges the more significant is the difference of the microbe frequency between the cohort supplemented with 125 mM of sodium formate and controls. The red colour highlights a significant frequency increase by sodium formate supplementation and the blue colour a significant decrease. (C) Heatmap reporting the microbiota frequencies at the family level.

