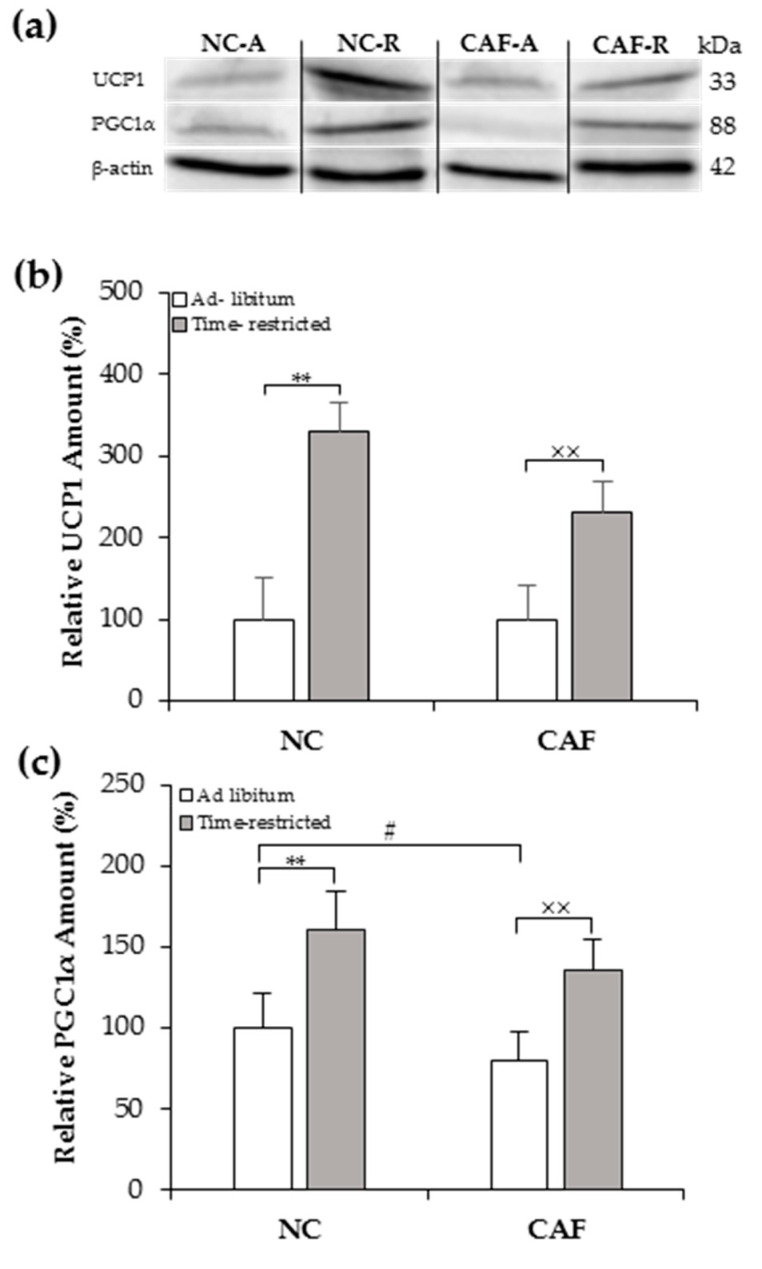
Figure 4.
Effects of time-restricted feeding on thermogenic protein levels in the inguinal WAT of normal chow and cafeteria fed rats as measured by Western blot: (a) representative blot of UCP1 and PGC1α; (b,c) densitometry quantification of UCP1 and PGC1α protein levels. NC–A: normal chow ad libfeeding; NC–R: normal chow time-restricted feeding; CAF–A: cafeteria diet ad libfeeding; CAF–R: cafeteria time-restricted feeding; NC: normal chow diet; CAF: cafeteria diet.Values are means ± S.D (n = 3) of ratios of specific protein levels to β-actin (Loading protein). Data of the NC–A group wereset to 100% and the rest of the values are referred to this. # p < 0.05 CAF–A vs. NC–A rats; ** p < 0.01 NC–R vs. NC–A rats; ×× p < 0.01 CAF–R vs. CAF–A rats (Mann–Whitney U-test).

