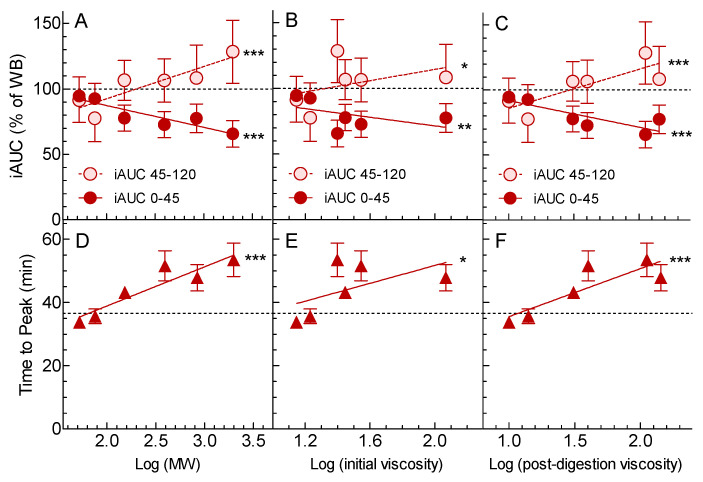
Figure 2.
Relationships between glycemic response and β-glucan MW and viscosity. Values are means ± SEM for n = 16 subjects. Panels A, B, and C show incremental areas under the curve (iAUC) expressed as a percentage of that elicited by the Control; dark red circles are iAUC over 0–45 min, light red circles are iAUC over 60–120 min. Panels D, E, and F show the time taken to reach peak glucose in minutes. Panels A and D show the relationships between glycemic responses and log (MW); panels B and E between glycemic responses and log (initial viscosity); and panels C and F between glycemic responses and log (post-digestion viscosity). The black dashed lines show the value for the Control, and dark red solid and light red dashed lines are regression lines. Significance of the regressions by ANOVA: * p < 0.05; ** p < 0.01; *** p < 0.001.

