
Figure 3. Synchronized Ca2+ Transients from Neuron and Astrocyte Populations Elicited by Single Sensory Stimulation (Hind Paw, 3 mA and 0.3 ms).
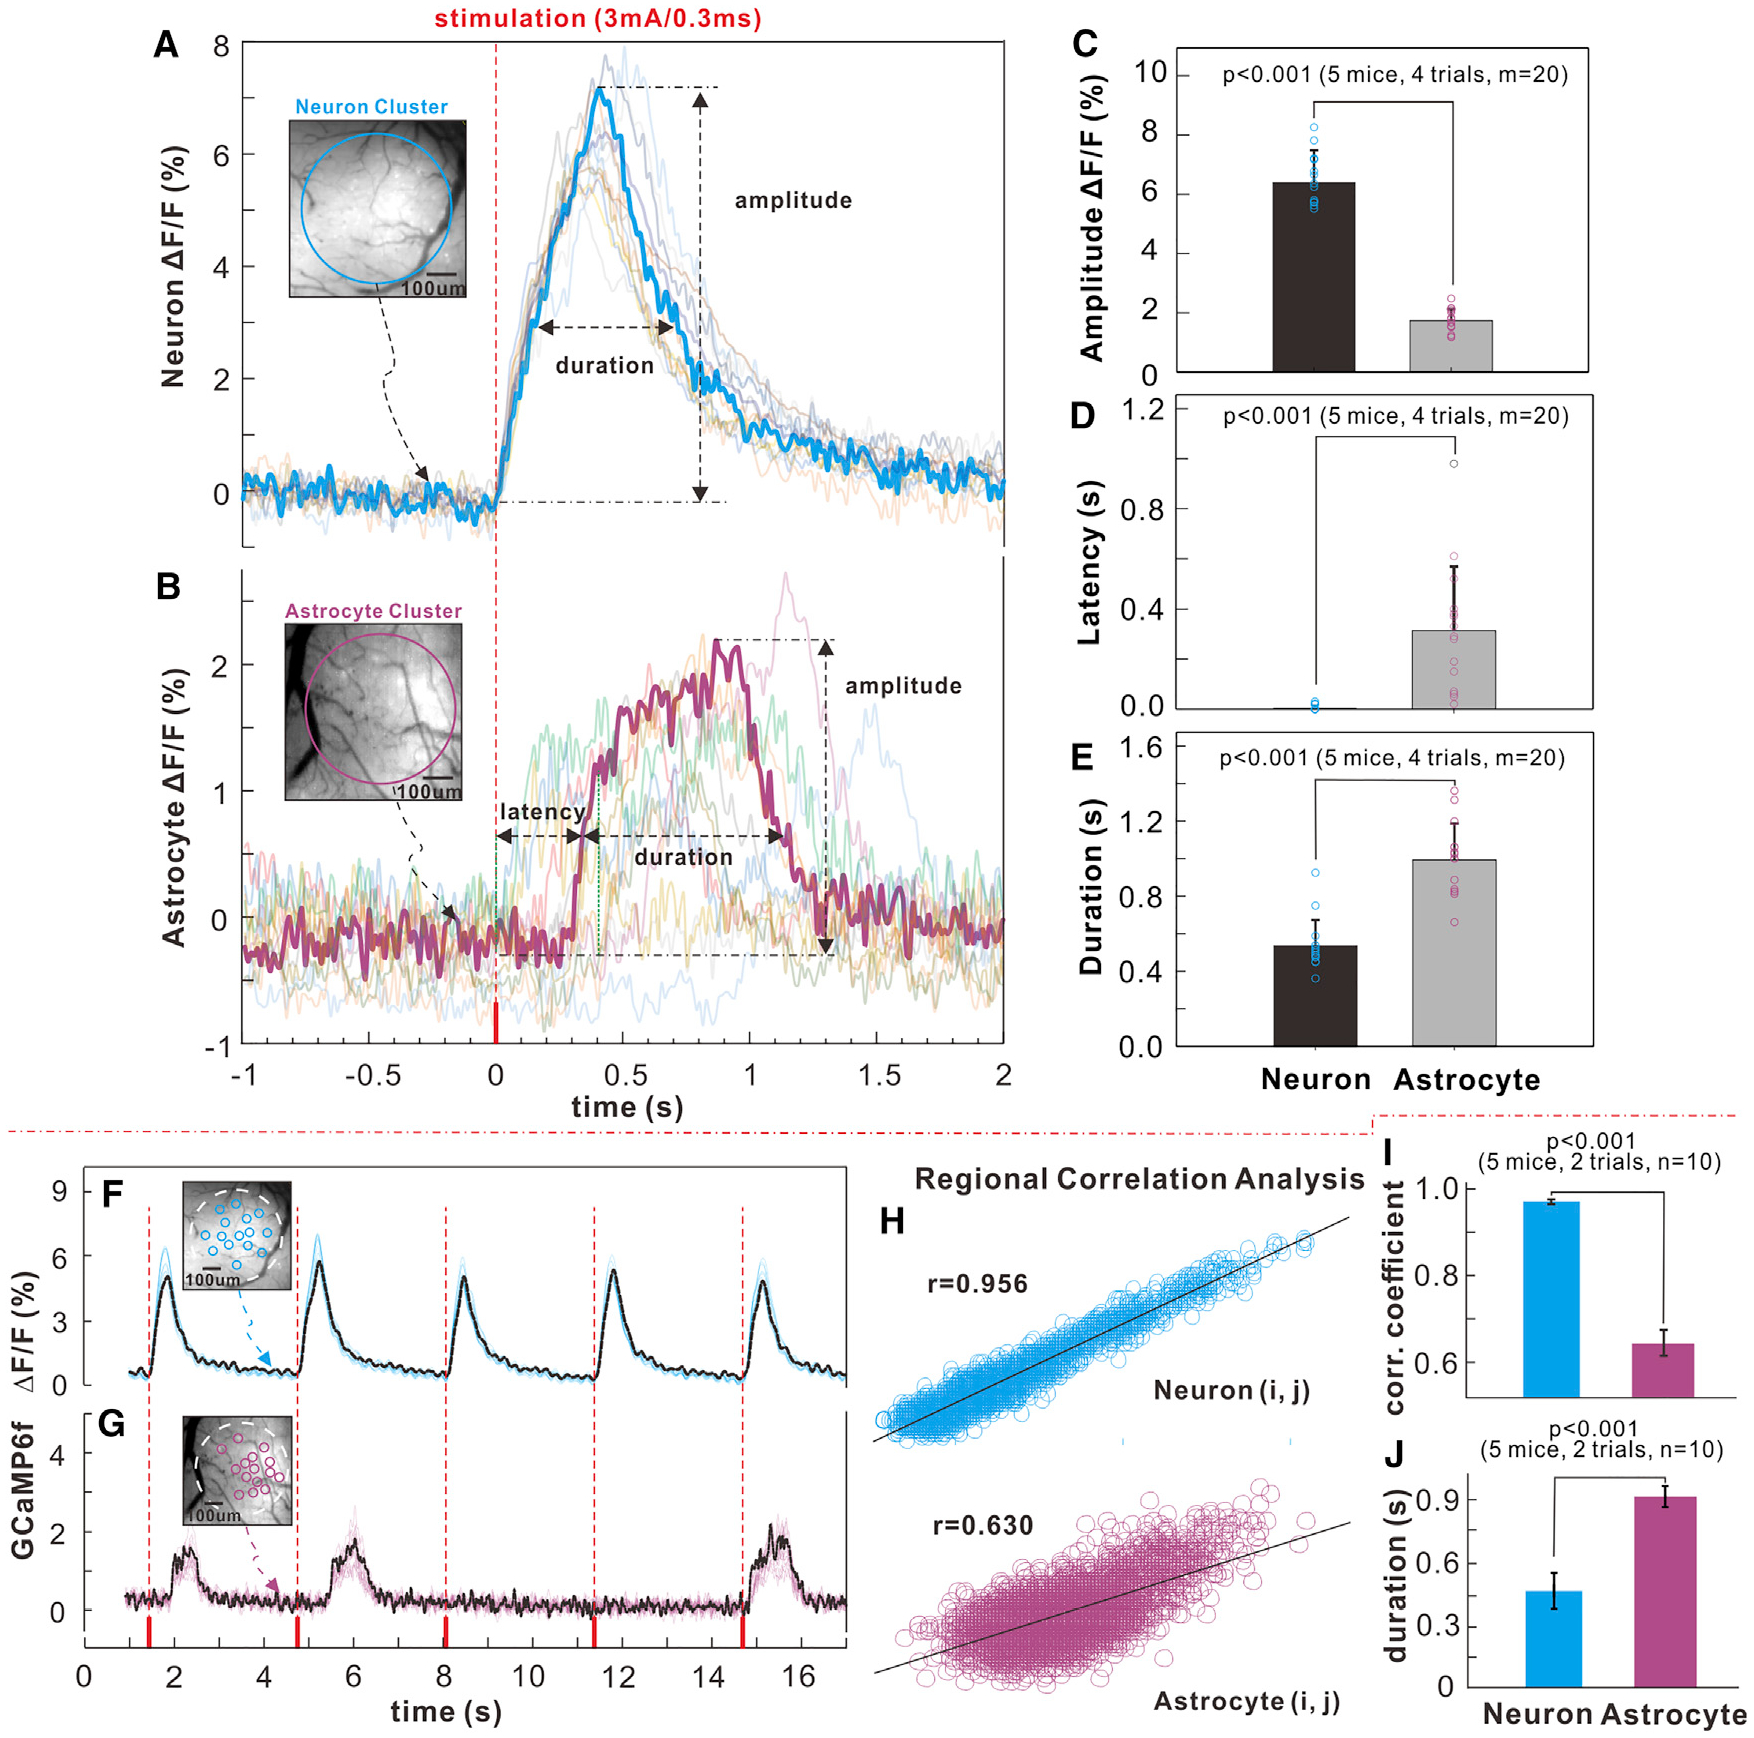
(A and B) Recorded neuronal and astrocytic Ca2+ traces of individual stimulations (m = 20) and their averaged traces (bold curves); the insets show the neuronal and astrocytic GCaMP6f fluorescence images.
(C–E) Statistical comparisons of amplitude, latency, and duration between neuronal and astrocytic GCaMP6f Ca2+ fluorescence transients.
(F and G) Traces of Ca2+ transients in single-cell ROIs (m = 15) elicited by a sensory stimulation for neuronal and astrocyte populations; small circles (~ϕ30 mm each, m = 15) represent the ROIs (blue for neurons, red for astrocytes) selected for cross-correlation analysis.
(H and I) Cross-correlation charts (i, j = 1,…,m) for neuronal and astrocyte populations and spatiotemporal correlations of neuronal and astrocytic Ca2+ transients.
(J) Durations of neuronal and astrocytic Ca2+ responses of single cells within the ROIs.
The data are shown as mean ± SEM.