
Figure 5. Synchronized Neuronal/Astrocytic Ca2+ and HbT Responses to 5-Hz Fast Sensory Stimulation (0.3 ms and 3 mA and 10 s).
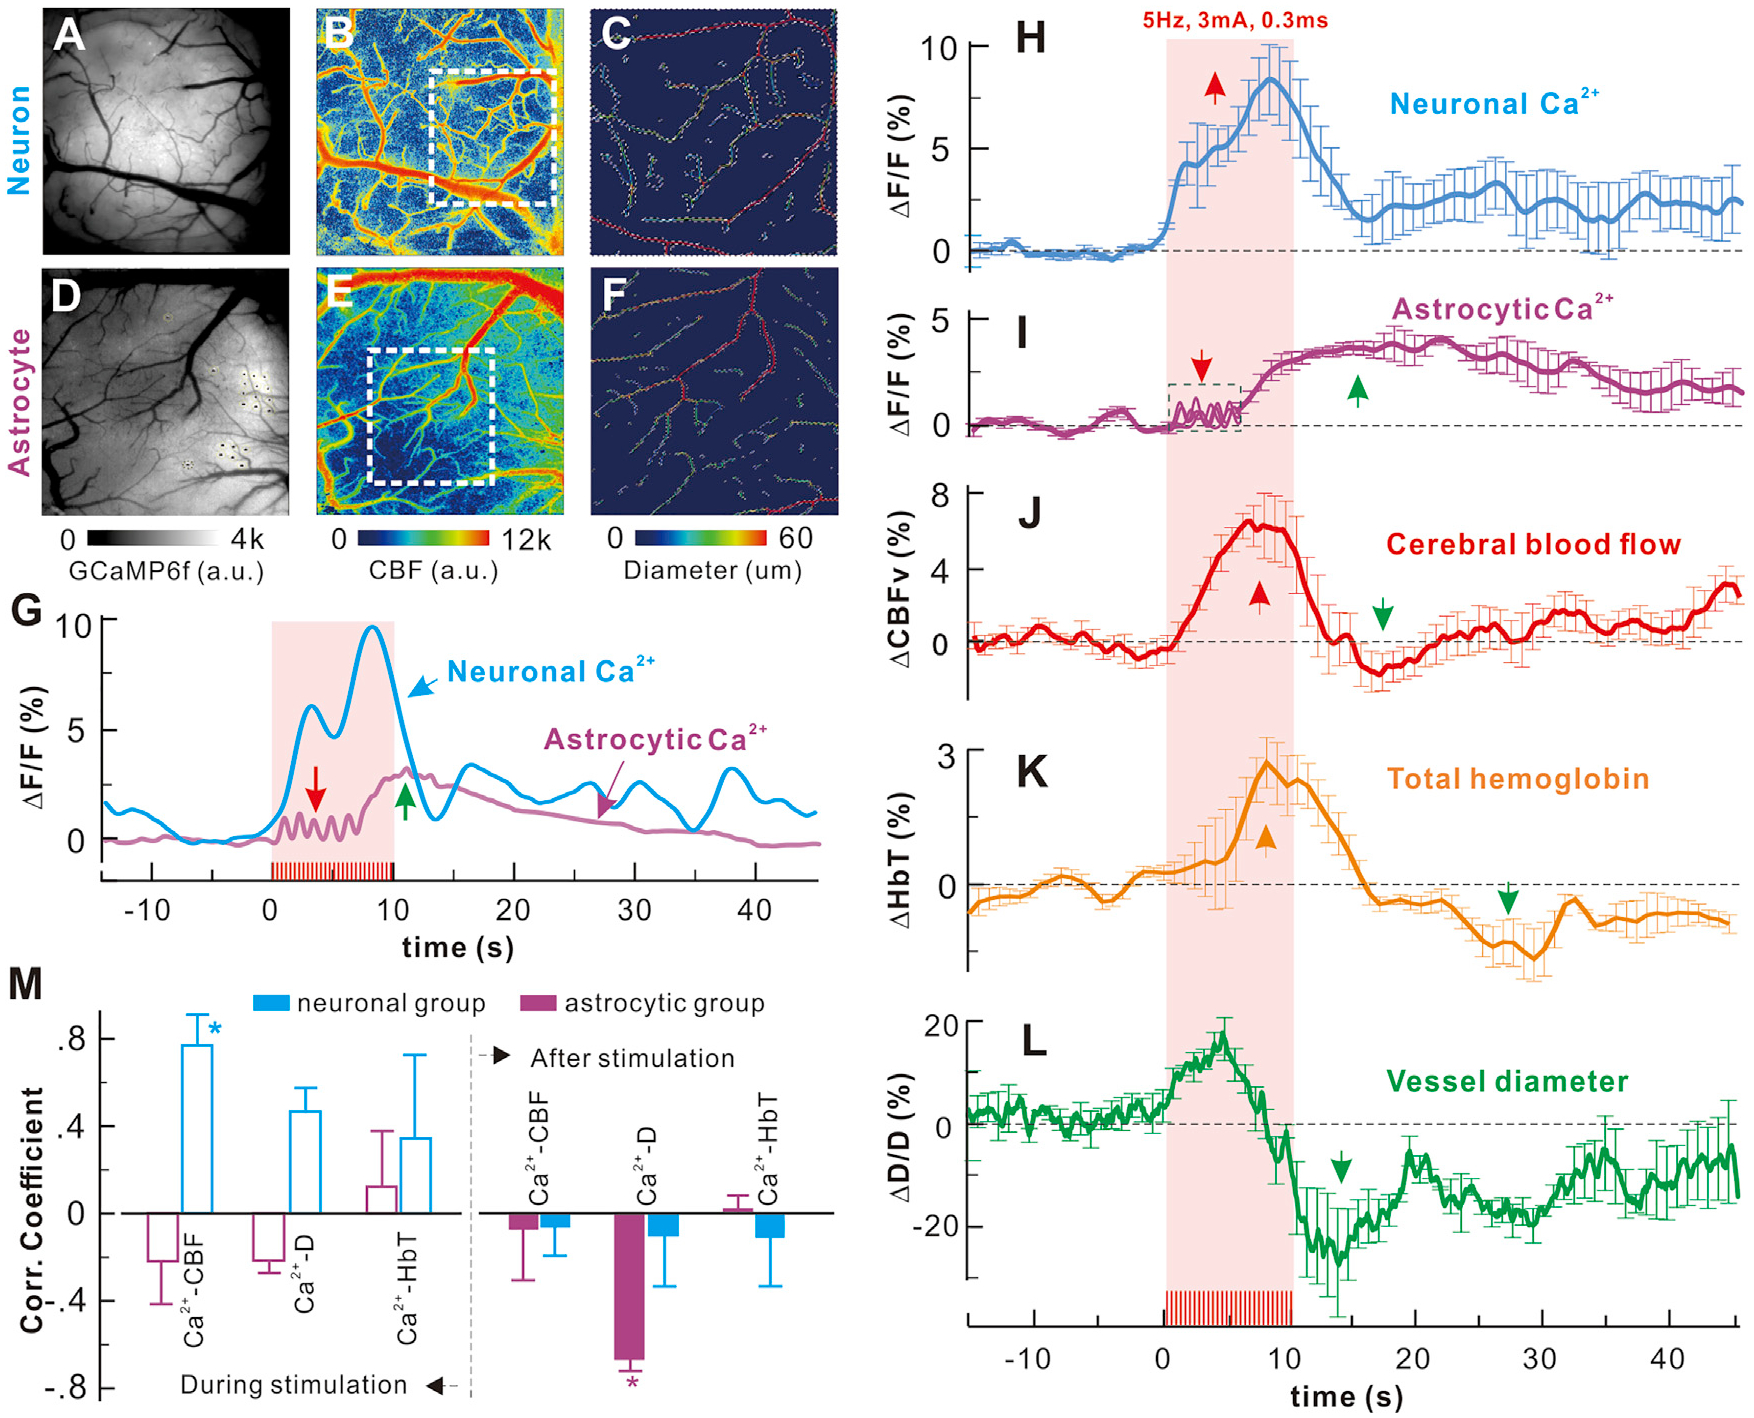
(A–C) Neuronal Ca2+, CBF, and angiographic images.
(D–F) Astrocytic Ca2+, CBF, and angiographic images.
(G) Time-lapse neuronal or astrocyte Ca2+ elevations; the red and purple arrows point to the early phase of the fast process and later phase of slow cumulative somatic responses.
(H–L) Simultaneous acquisition of averaged time-lapse neuronal or astrocytic Ca2+ and hemodynamic (ΔCBF, ΔHbT, and ΔD/D) responses to fast stimulation (6 unaveraged traces in the dashed box in I), showing fast processes Ca2+).
(M) Correlations of neuronal or astrocytic Ca2+ with ΔCBF, ΔHbT, ΔD/D during and after stimulation. The findings for the astrocytic Ca2+ elevations to 5-Hz stimulation at baseline and after topical cortical injection of Cbx and CPA, along with the corresponding neuronal Ca2+ changes, are shown in Figure S5.