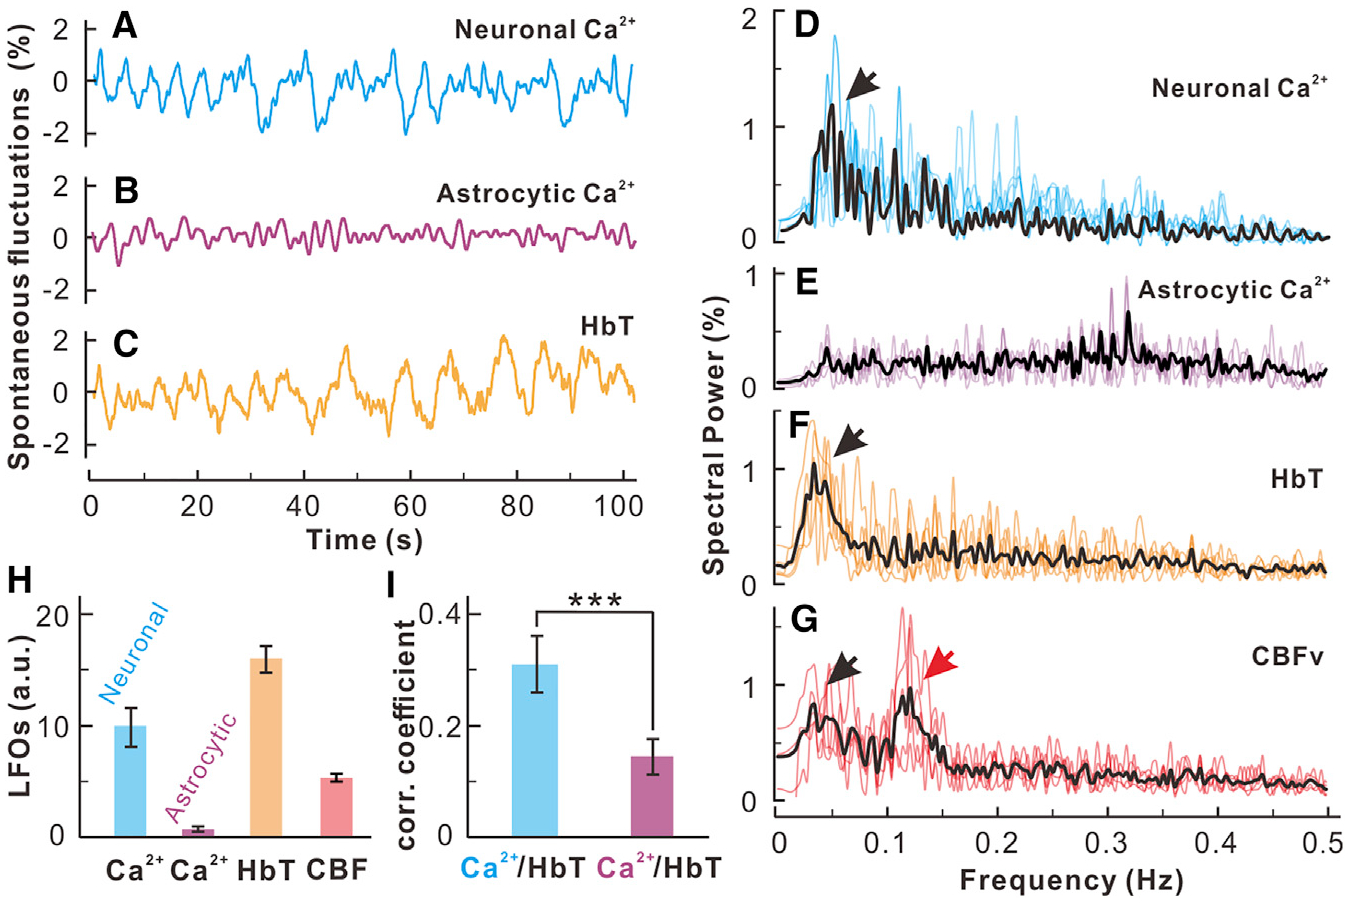
Figure 6. Resting State Neuronal but Not Astrocytic Ca2+ Slow Oscillations Correlated with Hemodynamic Slow Oscillations.

(A–C) Time traces of resting state low-frequency oscillations in synchronized neuronal Ca2+ (blue), astrocytic Ca2+ (pink), and HbT (red) acquired from the sensorimotor cortex.
(D–G) Power spectra of LFOs of synchronized neuronal Ca2+, synchronized astrocytic Ca2+, HbT, and CBFv of the surrounding cortical parenchymal tissue.
(H) Statistical comparisons of LFO amplitudes within its oscillation band (0.03–0.08 Hz) under normocapnia averaged across animals (n = 6 mice).
(I) Correlation of neuronal Ca2+ and HbT (blue bar) versus astrocytic Ca2+ and HbT (purple bar) (p = 0.014, n = 6 mice).
The data are shown as mean ± SEM. Black/red arrows, lower band (0.04–0.08 Hz) and higher-band (~0.12 Hz) slow oscillations. The results for the resting-state LFOs under hypercapnia, performed to assess the response of astrocytic LFOs during vasodilation, are shown in Figure S6.
