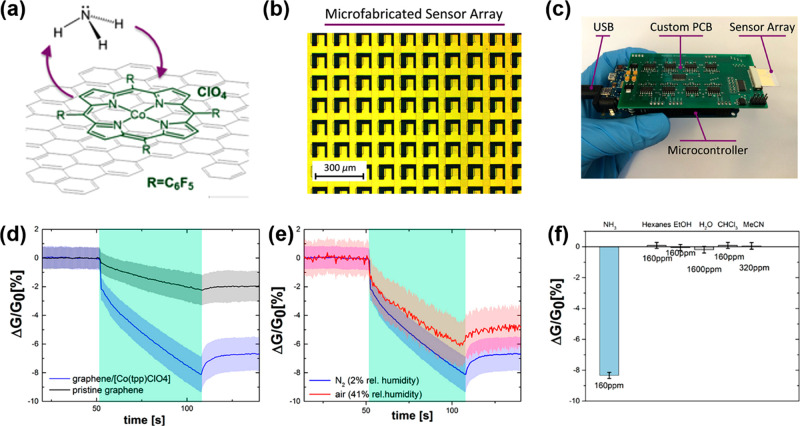
Figure 2.
(a) Chemical structure of the Co porphyrin molecule on top of graphene. (b) Microscope image of graphene sensor array. (c) Complete measurement system and sensor array insert. (d) Mean change in conductance upon exposure to 160 ppm of NH3 in nitrogen of the pristine graphene sensor and the Co porphyrin functionalized graphene with shaded regions representing plus or minus one standard deviation from the mean. (e) Mean change in conductance of the Co porphyrin functionalized graphene sheet upon exposure to 160 ppm of NH3 in dry nitrogen and air. (f) Selectivity comparison of the functionalized graphene. Adapted with permission from ref (11). Copyright 2018, American Chemical Society. Photograph in part c adapted with permission from ref (11).

