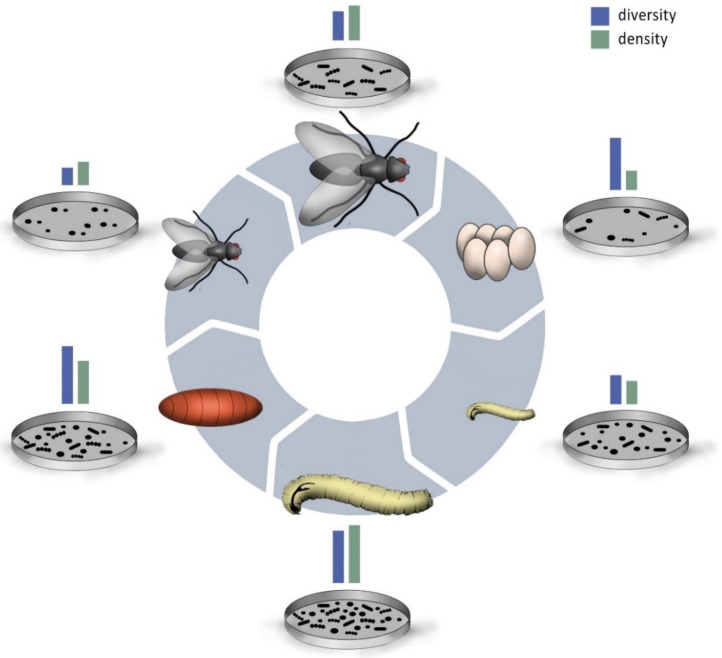
Figure 2.
Schematic representation of the changes in gut bacterial density and diversity over the course of the life cycle including egg, larval, pupal, and adult life stages that is based on the current literature reporting on seven species (Table S1). In green: relative gut bacterial community (GBC) density, in blue: relative GBC diversity. Relative changes in gut bacterial diversity and densities are represented by the different shapes and numbers of microbes in a Petri dish. (Picture: Jennifer Gabriel).

