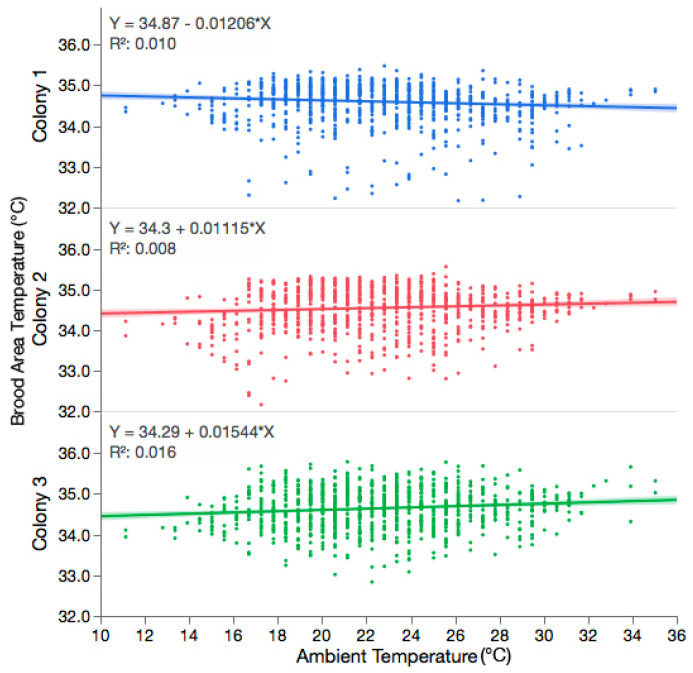
Figure 1.
Regression analysis showing the relationship between observed hourly brood area temperature (Y) and hourly ambient temperature (X) for each colony. There was no significant correlation between observed brood temperature and ambient temperature for Colony 1 (y = 34.87 − 0.01206x, df = 954, r2 = 0.010, p = 0.0017), Colony 2 (y = 34.30 + 0.01115x, df = 954, r2 = 0.008, p = 0.0069), or Colony 3 (y = 34.29 + 0.01544x, df = 953, r2 = 0.016, p < 0.0001).

