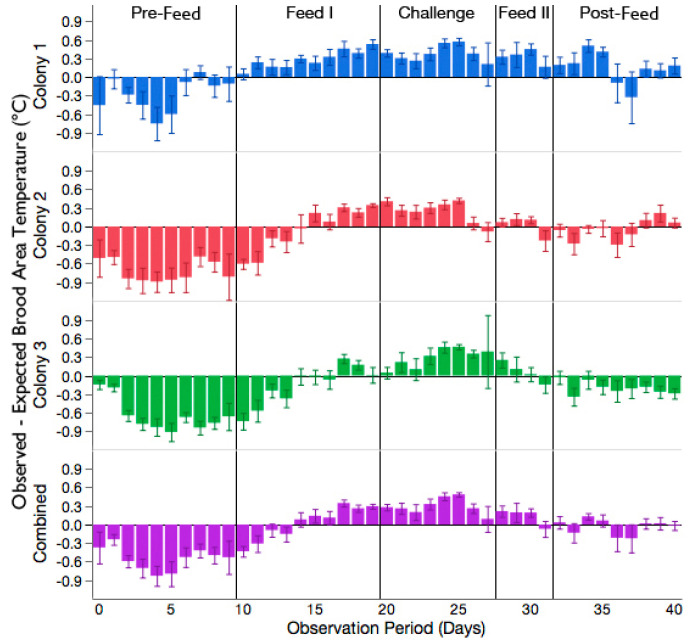
Figure 3.
The daily difference in observed–expected temperature of the brood area for each colony and the average of the three colonies combined. A value less than 0 demonstrates that the observed temperature of the brood area was less than the expected temperature and a value greater than 0 demonstrates that the observed temperature of the brood area was greater than the expected temperature. Vertical lines mark the boundaries between the observation periods. Each bar represents the mean daily difference ±95% CI.

