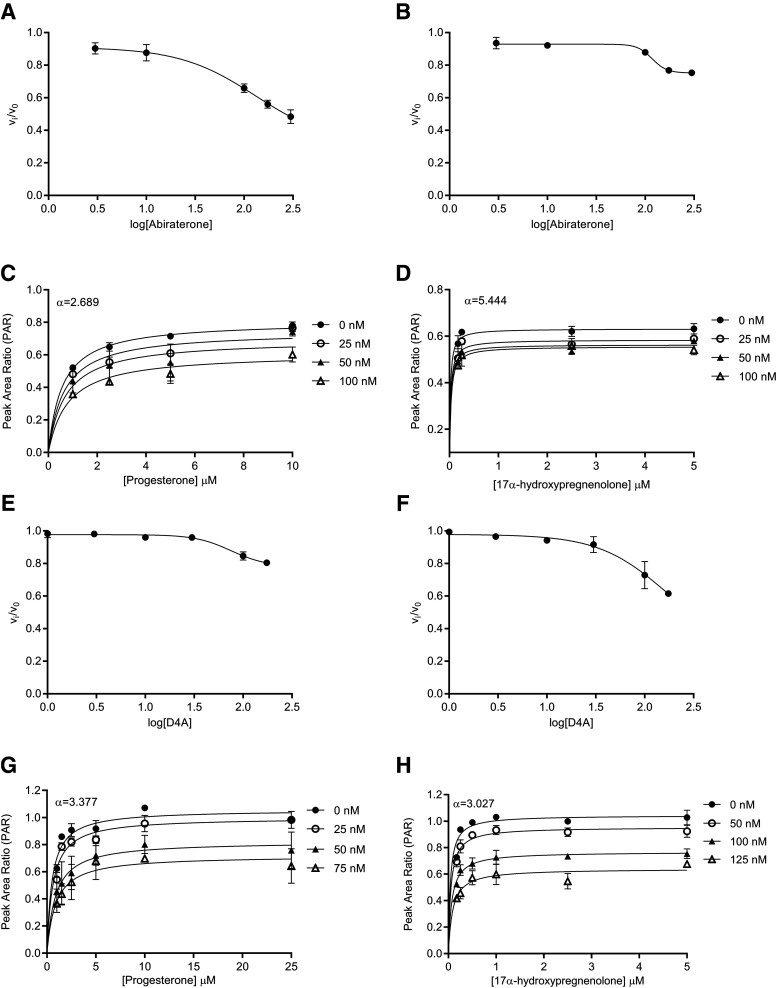
Fig. 3.
Reversible inhibition of CYP17A1 by abiraterone and D4A. Concentration-response plots represent the initial inhibited state (EI) of the CYP17A1-mediated 17α-hydroxylase and C17,20-lyase enzymatic reactions when slow-, tight-binding inhibitors (A and B) abiraterone and (E and F) D4A were introduced. The measured initial velocities ( ) were used together with velocity of the uninhibited reaction (
 ) to calculate the fractional velocities across various concentrations of abiraterone and D4A (1–300 nM). Using eq. 2, apparent inhibition constants (
 ) for the initial CYP17A1-inhibitor encounter complexes were first obtained from the midpoint of isotherm curves.
  values were subsequently used in nonlinear regression analyses (eq. 3a) to determine the forward (
 and reverse
  isomerization constants. Reversible inhibition experiments were also performed in the presence of multiple substrate (progesterone or 17α-hydroxypregnenolone) and (C and D) abiraterone or (G and H) D4A concentrations. To discern the mode of inhibition, Michaelis-Menten plots generated were subjected to double reciprocal transformations to yield Lineweaver-Burk graphs as presented in Supplemental Fig. 4. Based on the identified mode of inhibition, the inhibition constant for the initial EI complex (
 could eventually be derived from
  . Each point represents the mean ± S.D. of triplicate determinations.

