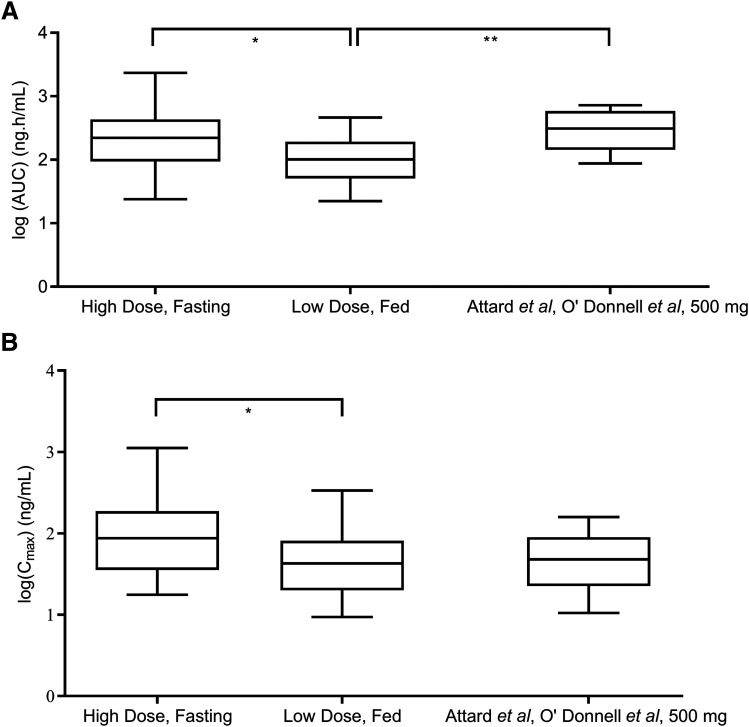
Fig. 7.
Investigating potential correlations between abiraterone drug levels and the extent of DHEA-S suppression. Results from the phase II study by Szmulewitz et al. (2018) demonstrated how (A) the area under the plasma concentration-time curve of abiraterone from 0 to 4 hours (AUC0–4 hours), and (B) peak plasma concentrations (Cmax) remained significantly higher in the standard-dose arm (1000 mg AA, fasting, n = 20) compared with the low-dose arm (250 mg AA, fed, n = 20) (two-sided P value for AUC0–4 hours = 0.0417, and two-sided P value for Cmax = 0.0474). Combined analyses of phase I trials (Attard et al., 2008; O’Donnell et al., 2004, n = 10) in (A and B) revealed that administration of 500 mg of AA in a fasted state yielded AUC values that were greater than that measured in the low-dose arm (two-sided P value = 0.0038), whereas Cmax measurements were not significantly different. AUC and Cmax data were log-transformed and groups comparisons were performed using repeated-measures one-way ANOVA and Dunnett’s multiple comparisons tests.

