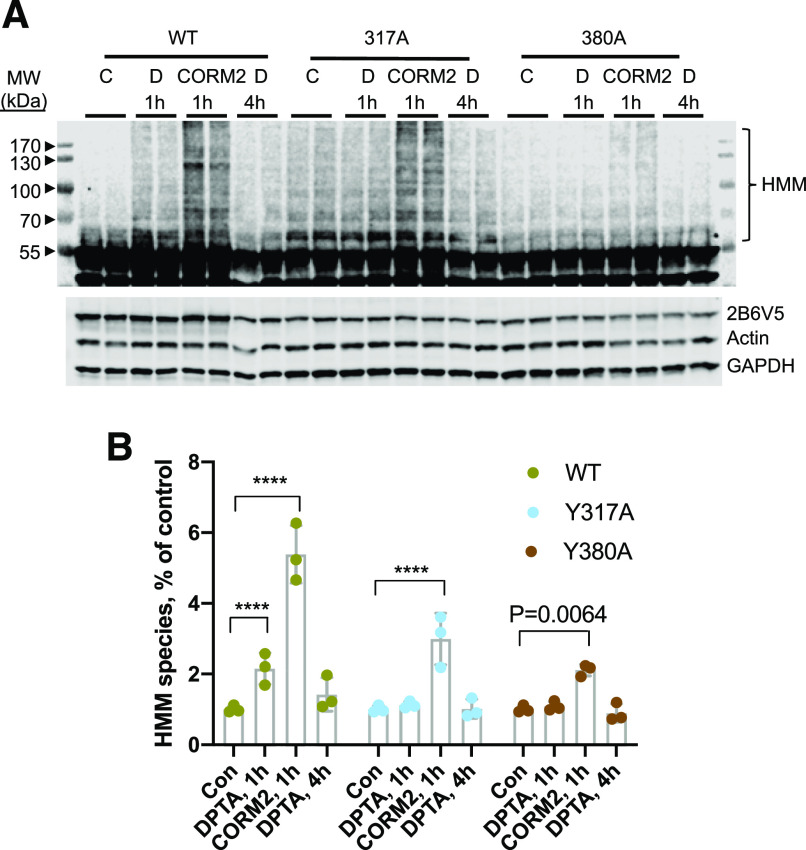
Fig. 10.
CORM2-stimulated HMM species formation in CYP2B6 mutant enzymes. HuH7 cells expressing WT-CYP2B6V5 or the Y317A and Y380A mutants were treated with DPTA (500 mM) or CORM2 (1 mM) for the indicated time, and total cell lysates were subjected to immunoblotting. (A) Representative immunoblotting image. (B) Quantified data from three independent experiments. Values are the means and 95% CI relative to controls. Quantification of HMM species. Values are the means and 95% CI of three independent experiments and levels relative to the respective controls are shown. Data were analyzed by two-way repeated-measures ANOVA with treatment group treated as a within-subjects factor to account for clustering and cell line treated as a between-subjects factor. P values (Tukey test) for groups exhibiting significant differences from WT are shown, ****P < 0.0001. Con, control; MW, molecular weight.

