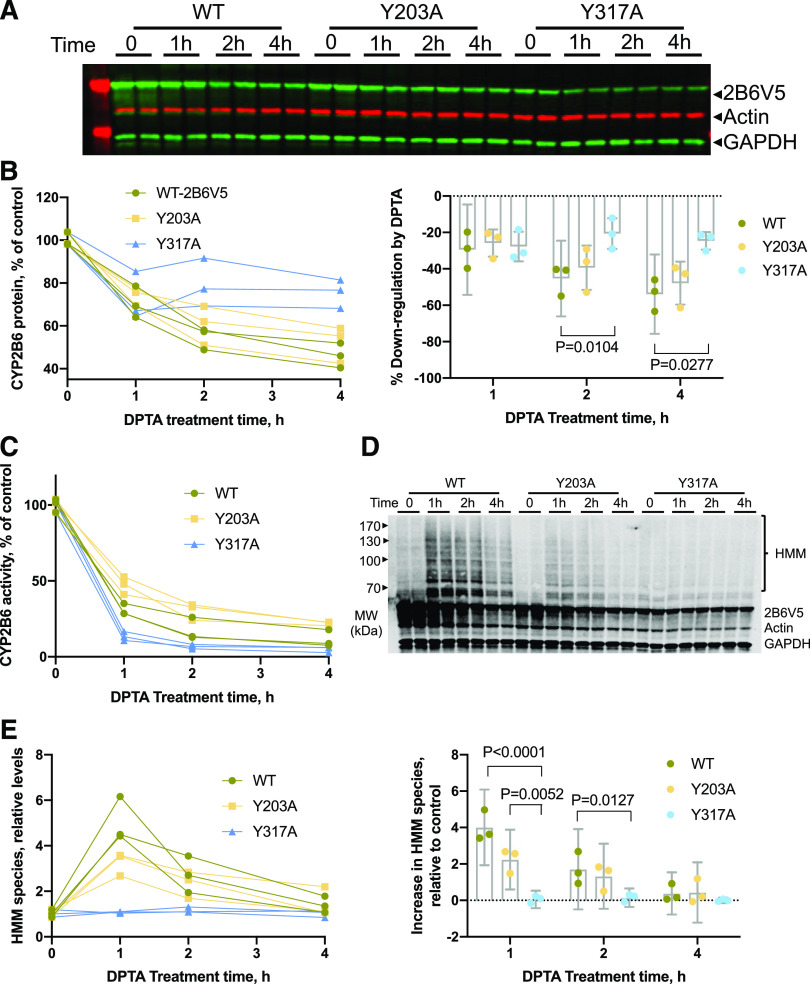
Fig. 3.
Formation of HMM species on CYP2B6V5 and Y203A mutant but not Y317A mutant in HuH7 cells. HuH7-2B6V5 cell lines were treated with 500 μM DPTA for the indicated times, and total cell lysates were used for immunoblotting with antibodies to the V5 tag, actin, and GAPDH. (A) Representative Western blot showing time-dependent downregulation of CYP2B6 and mutants by DPTA. (B) Quantified data from three experiments. The left panel shows the time courses from each individual experiment, and the right panel shows means and 95% CI of the differences from 0 time. (C) The enzyme activities of CYP2B6 and mutants, measured by 7-hydroxy-4-trifluoromethylcoumarin formation from EFC. (D) Representative immunoblotting image showing HMM formation on WT 2B6 and Y203A mutant with respect to DPTA treatment. (E) Quantified HMM data from three experiments. The left panel shows the time courses from each individual experiment, and the right panel shows means and 95% CI of the differences from 0 time. For (B and E), data were analyzed by two-way repeated-measures ANOVA with time as a within-subjects factor (1, 2, 4 hours) and cell line as a between-subjects factor. P values for comparisons between groups showing a significant difference by Tukey test are shown. MW, molecular weight.

