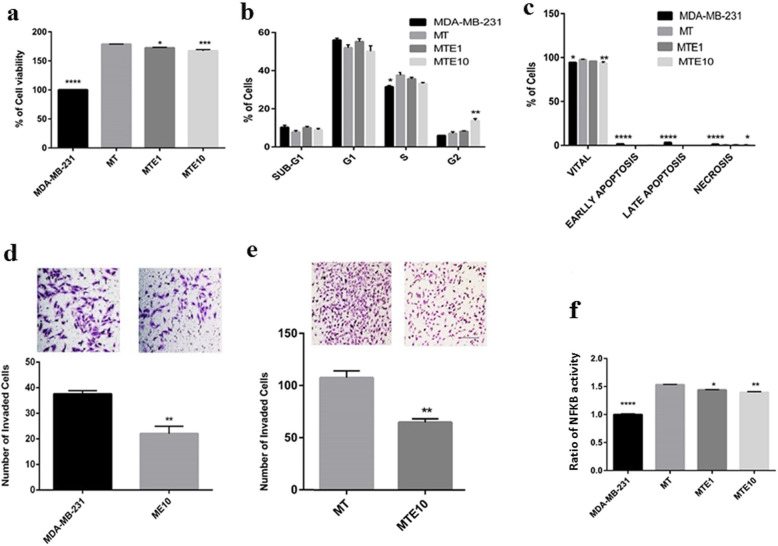
Fig. 2.
Assessing the anti-cancer effects of Etanercept in presence of macrophages (THP-1). a MTT viability test in MDA-MB-231 plus THP-1 cells following treatment of cells with 1 or 10 μg/ml Etanercept. Data represent mean ± sem for six replicates. MTE1 and MTE10 indicate THP-1 plus MDA-MB-231 plus Etanercept at concentrations 1 and 10 μg/ml, respectively. b Analysis of cell cycle in co-cultured MDA-MB-231 cells treated with 1 or 10 μg/ml Etanercept. Data represent mean ± sem of number of cells in each phase for 3 replicates. E1 = Etanercept at concentration 1 μg/ml, E10 = Etanercept at concentration 10 μg/ml. c Measurement of apoptosis using annexin-PI. Data represent mean ± sem of number of co-cultured cells in each phase for 3 replicates. d-e Matrigel invasion test to evaluate the effect of 10 μg/ml Etanercept (E10) on the invasive properties of MDA-MB-231 cells (ME10). MDA-MB-231 cells plus co-cultured THP-1 (MT) that were treated with 10 μg/ml of Etanercept (MTE10) are also shown. As illustrated, Etanercept decreased invasion of MDA-MB-231 cells. The anti-invasion efficacy diminished in presence of macrophages (T). * P < 0.05 **P < 0.01, ***P < 0.0001. f Measurement of NFKB activity following treatment with Etanercept. MT = MDA-MB-231 plus THP-1 cells, MTE1 and MTE10 = THP-1 cells plus MDA-MB-231 plus Etanercept at concentrations 1 and 10 μg/ml, respectively

