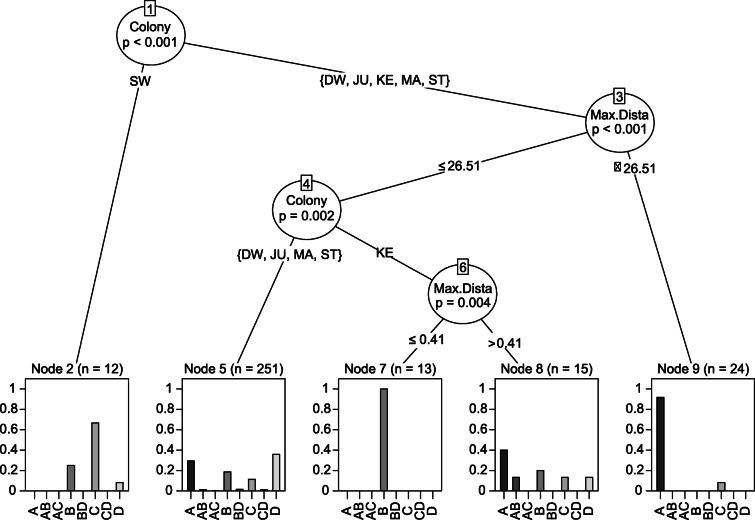
Fig. 6.
Conditional inference tree for the effect of colony and maximum distance on dominant habitat (A = Ocean, B = Coastal, C = Terrestrial natural, D = Terrestrial anthropogenic, AB, AC, BD, and CD are combinations of the major categories). Each oval contains one of the two explanatory variables, colony or maximum distance. Following the branches lead to the partitions of the variables based on a significance value of p ≤ 0.05. The value above each leaf represents the total number of observations that fall within the node. Histograms show the probability of dominant habitat. Colonies DW = Dwarskersbos, MA = Malgas Island, JU = Jutten Island, ST = Strandfontein, KE = Keurbooms, SW = Swartkops

