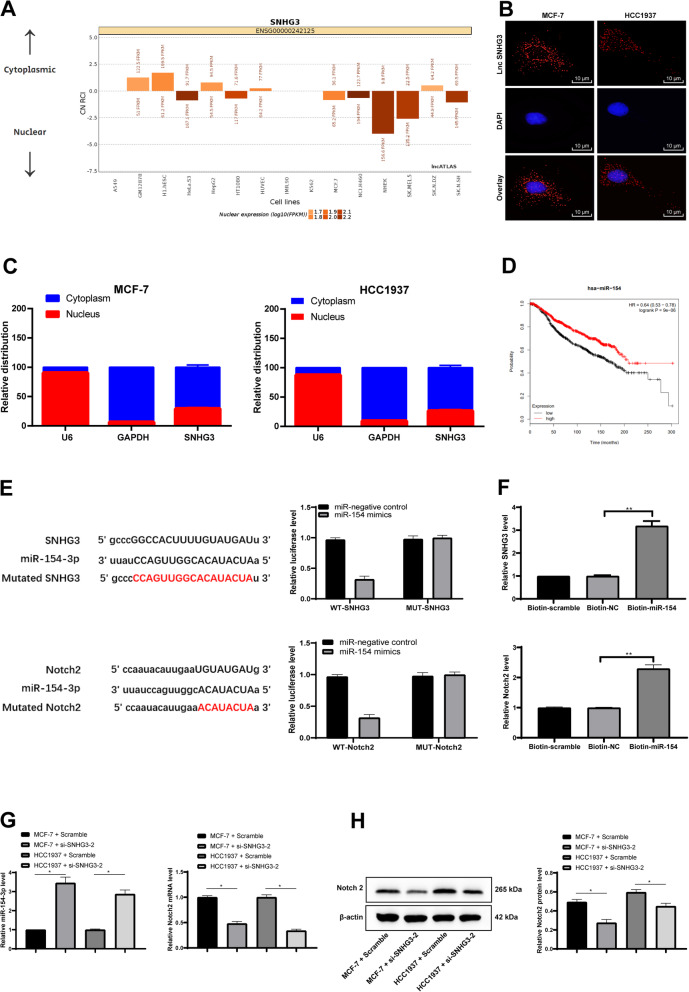
Fig. 3.
SNHG3 competitively bound to miR-154-3p and regulated Notch2. a. Subcellular localization of SNHG3 in the LncATLAS database; b. FISH experiments with probes targeting SNHG3 were performed to validate the subcellular localization of SNHG3 in MCF-7 and HCC1937 were stained with probes targeting SNHG3 (red stain), and the nuclei were stained with 4′,6-diamidino-2-phenylindole (blue stain). The merged image showed SNHG3 was cytoplasm-sublocalized in MCF-7 and HCC1937; c. Nuclear and cytoplasmic expression of SNHG3 in MCF-7 and HCC1937 cells determined by RT-qPCR; d. Kalpan-Meier plotter predicted breast cancer prognosis via miR-154-3p expression level; e. Luciferase reporter plasmid containing SNHG3-WT or SNHG3-Mut was transfected into 293 T cells together with miR-154-3p in parallel with an miR-NC plasmid vector; luciferase reporter plasmid containing SNHG3-WT or SNHG3-Mut was transfected into 293 T cells together with miR-154-3p in parallel with an miR-NC plasmid vector; luciferase reporter plasmid containing NOTCH2-WT or NOTCH2-Mut was transfected into 293 T cells together with miR-154-3p in parallel with an miR-NC plasmid vector; f. the binding relationship between miR-154-3p, SNHG3 and Notch2 was verified by RNA pull-down assay; g. RT-qPCR was performed to determine the levels of miR-154-3p and Notch2 mRNA in MCF-7 and HCC1937 cells.; h. Western blot assay was performed to determine Notch2 protein level in MCF-7 and HCC1937 cells (representative images were shown, full-length gels are presented in Supplementary Figure 2); J. RT-qPCR and western blot analysis were performed to determine Notch2 level in MCF-7 and HCC1937 cells. Three independent experiments were performed. Data are expressed as mean ± standard deviation; one-way ANOVA and Tukey’s Multiple comparison test were used to determine statistical significance, *p < 0.05

