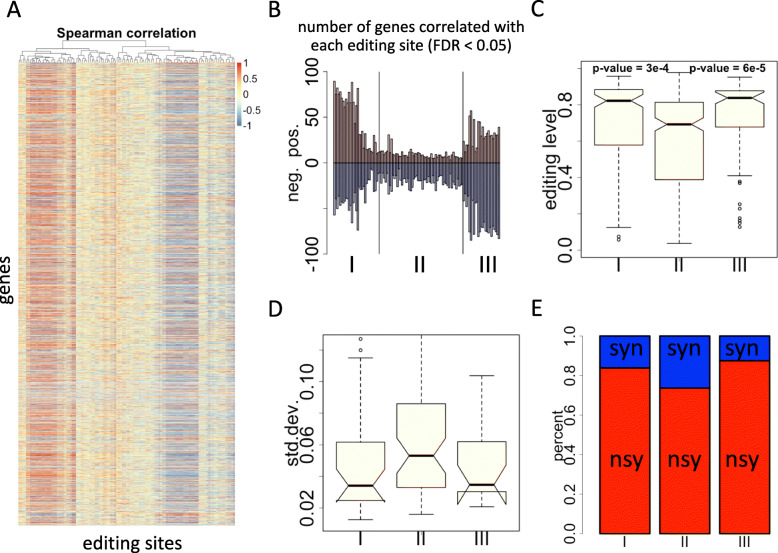
Fig. 3.
Pairwise correlation between editing levels and gene expression levels (Ribo-seq RPKM) in six samples used in this study. a Heatmap showing the Spearman correlation coefficient between editing levels and gene expression levels. b Numbers of significantly correlated (multiple testing corrected FDR < 0.05) genes of each C-to-U editing site. The editing sites are classified into three classes based on the numbers of positively and negatively correlated genes. c Box-and-whiskers showing the editing levels of three classes of editing sites. P-values are calculated by Wilcoxon rank sum tests. d Box-and-whiskers showing the standard deviation of editing levels of three classes of editing sites. e Barplot showing the fractions of nonsynonymous editing sites among three classes of sites

