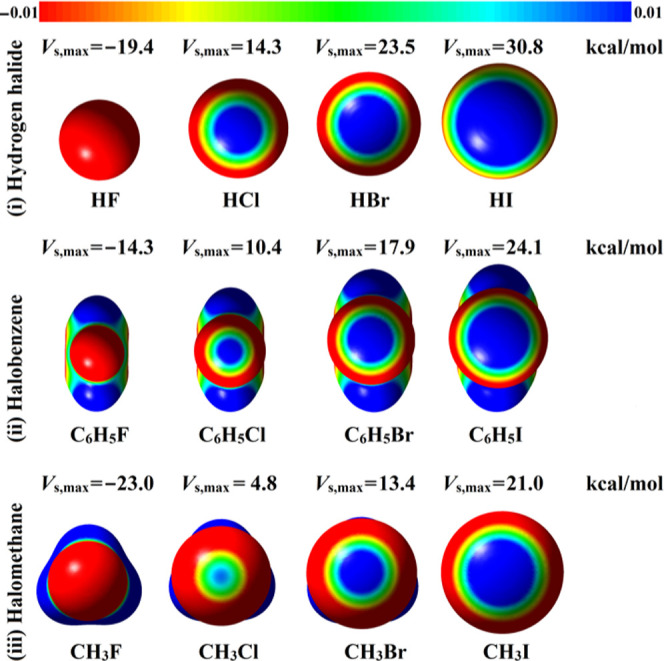
Figure 2.

Molecular electrostatic potential (MEP) maps of hydrogen halide (HX), halobenzene (C6H5X), and halomethane (CH3X) molecules plotted on to 0.002 au electron density contours. The electrostatic potential varies from −0.01 (red) to +0.01 (blue) au. The calculated maximum positive electrostatic potentials (Vs,max) of the studied molecules are given in kcal/mol.
