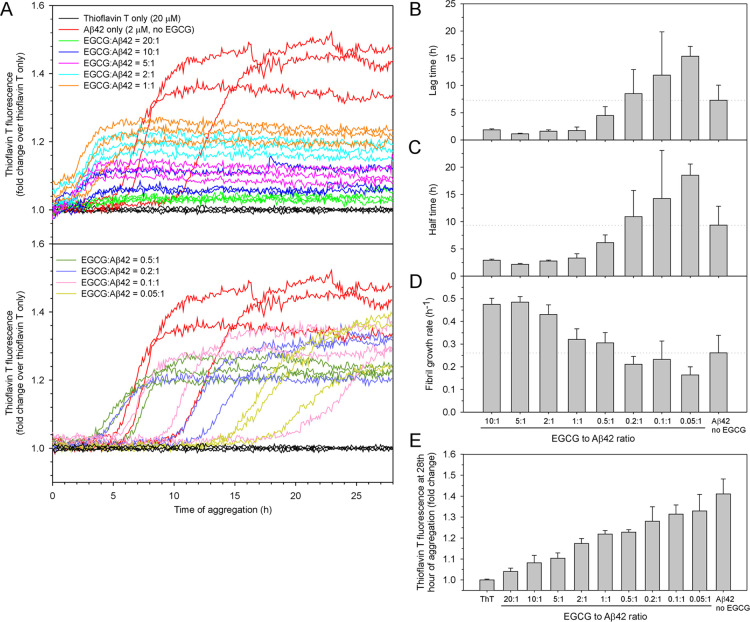
Figure 2.
Effect of EGCG on the rate and yield of Aβ42 aggregation. (A) Aggregation of 2 μM Aβ42 in the absence and presence of 0.1, 0.2, 0.4, 1, 2, 4, 10, 20, and 40 μM of EGCG, representing EGCG-to-Aβ42 ratios of 0.05:1, 0.1:1, 0.2:1, 0.5:1, 1:1, 2:1, 5:1, 10:1, and 20:1. The aggregation was performed in PBS buffer at 37 °C without agitation. Three replicates were performed for all samples. (B–D) Lag time, half-time, and fibril growth rate were obtained by fitting the aggregation data to a sigmoidal function (see Figure 1 and Methods). (E) Fluorescence intensity in the 27th hour of aggregation is plotted as a function of the EGCG-to-Aβ42 ratio. Columns are the mean and error bars are the standard deviation from the three aggregation repeats.

