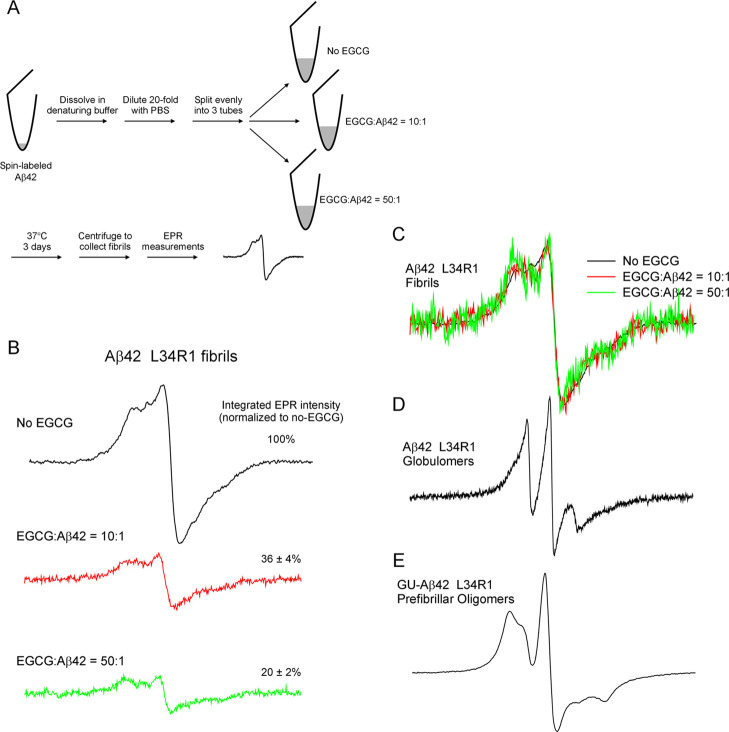
Figure 4.
EPR studies of spin-labeled Aβ42 fibrils formed in the absence and presence of EGCG. (A) Schematic diagram showing the experimental procedure. (B) EPR spectra of Aβ42 fibrils spin-labeled at residue L34. R1 represents the spin label and is introduced by site-directed spin labeling. (C) EPR spectra in panel B are normalized to the same centerline amplitude to allow comparison of the EPR line shape. Note that the EPR spectra in the presence of EGCG show similar line shape as the no-EGCG sample, indicating similar fibril structure. (D) EPR spectrum of Aβ42 L34R1 globulomers, reproduced using data in Gu et al.44 (E) EPR spectrum of Aβ42 L34R1 prefibrillar oligomers, reproduced using data in Gu et al.45 The scan width is 200 G for all of the EPR spectra.

