
Figure 2. Forest plot of the prevalence of hospital-associated disability (HAD): hospital-based studies only.
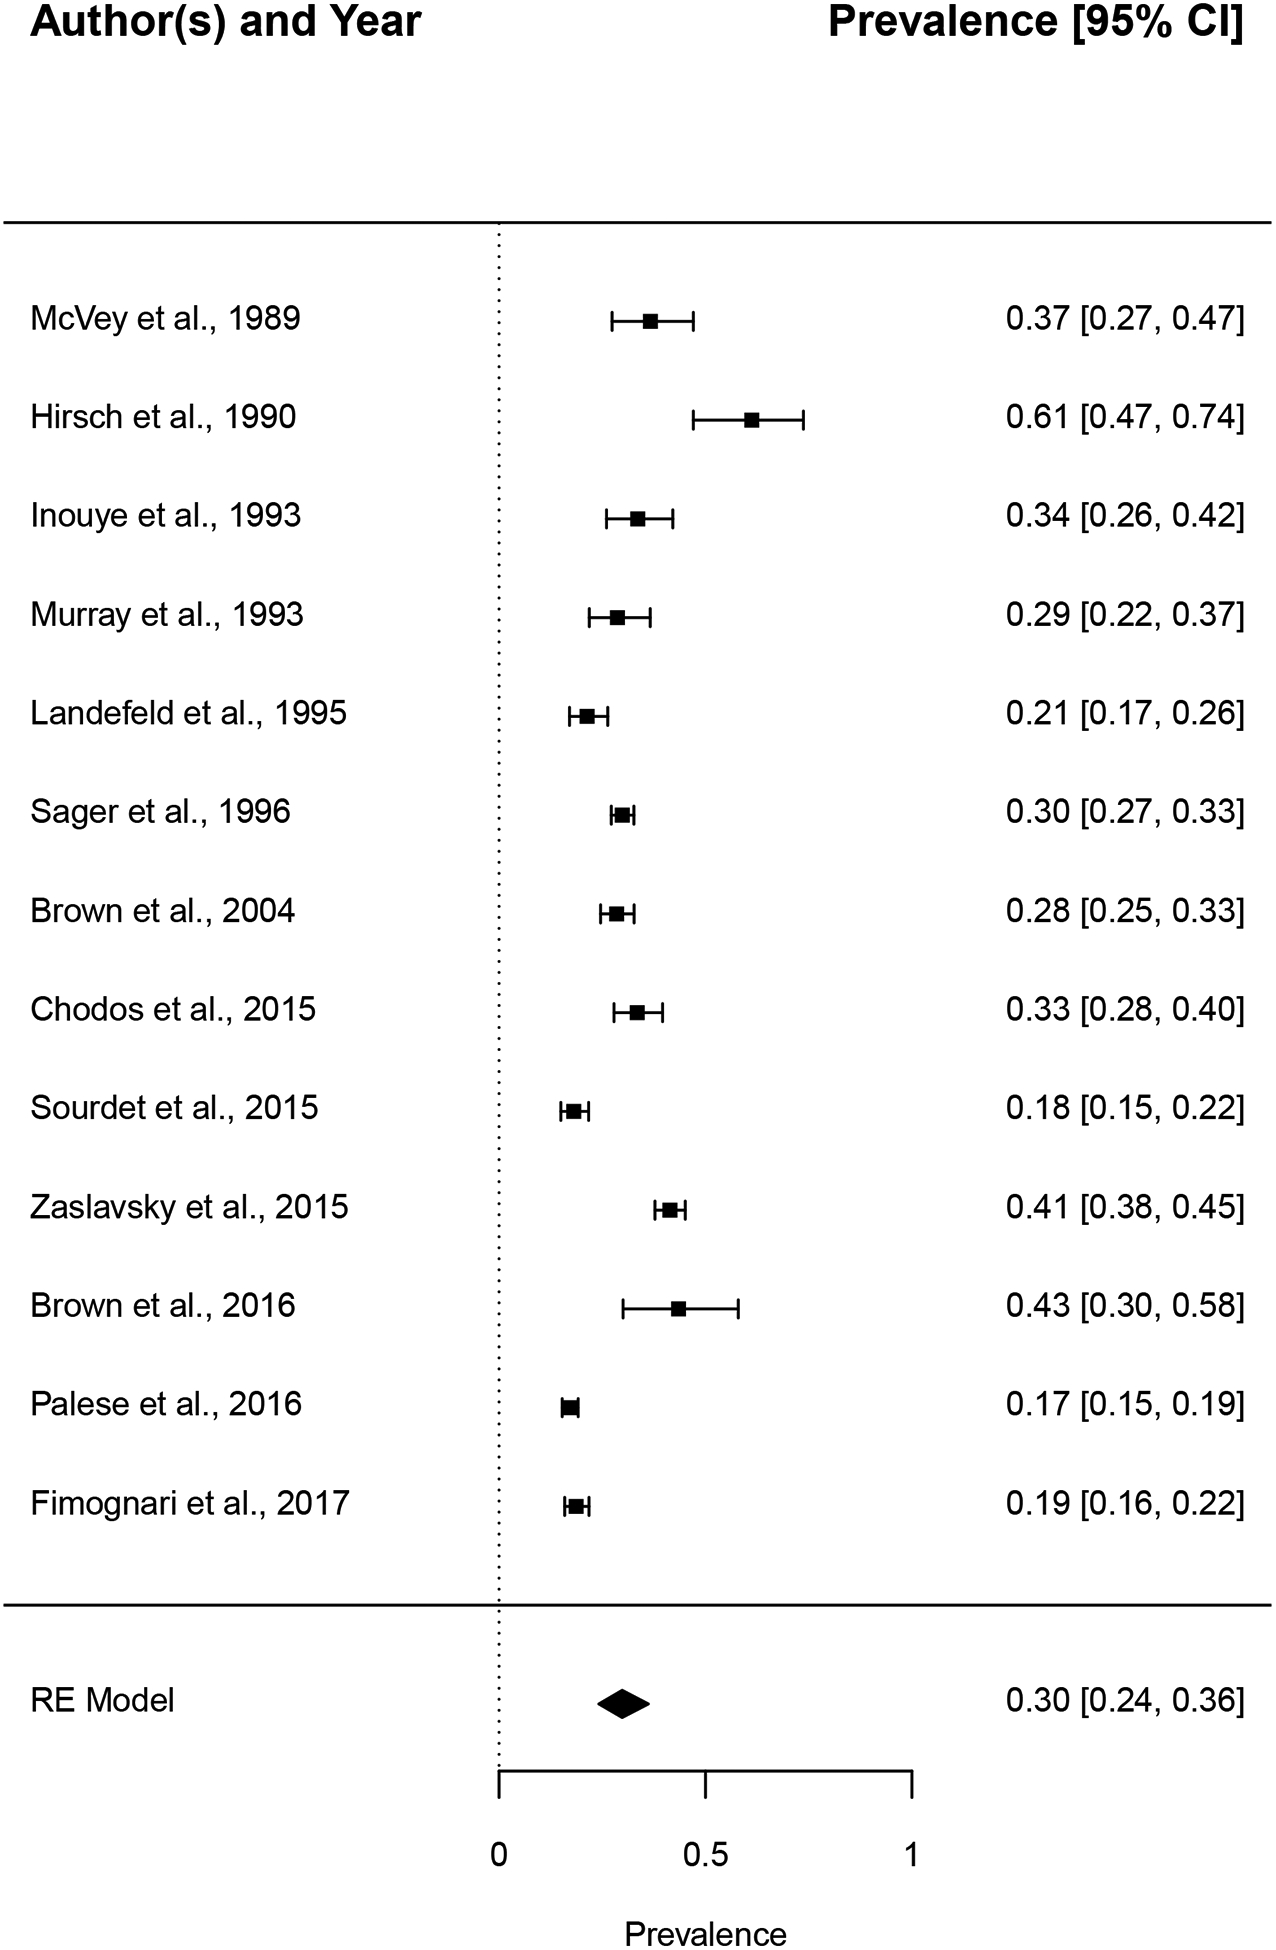
Prevalence rates from 13 individual hospital-based studies were combined using random-effects meta-analysis with a generalized linear mixed model. Vertical reference line indicates prevalence rate of 0 (no HAD); size of squats is proportional to the weight of the study in the analysis. CI=confidence interval.