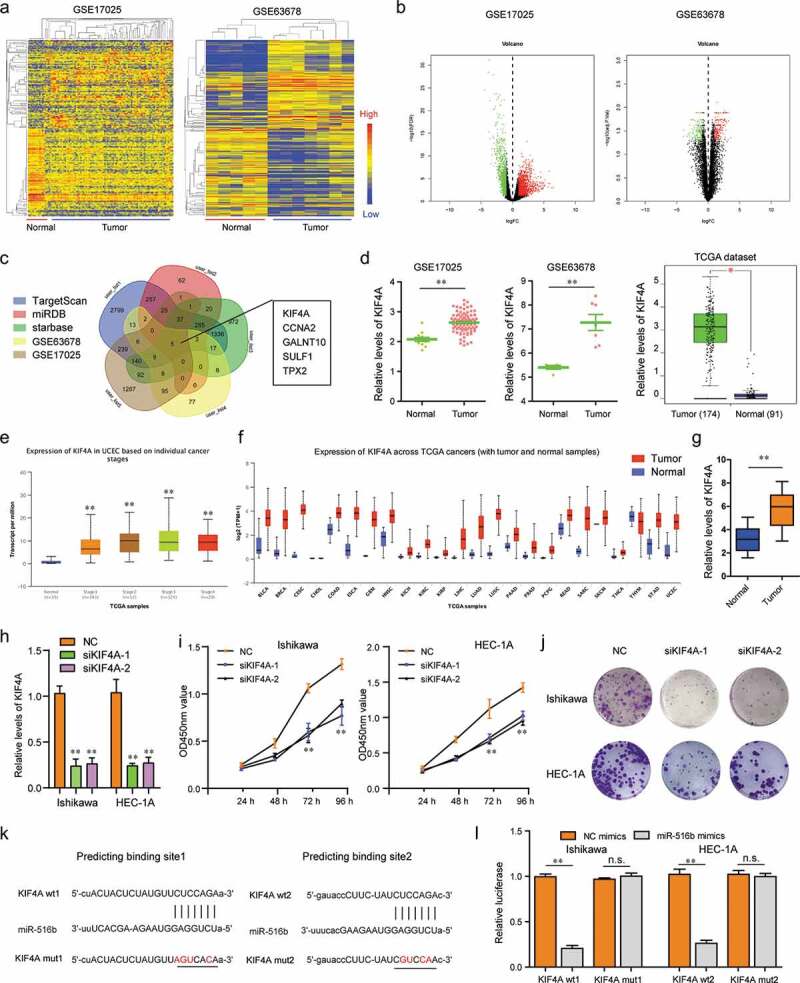
Figure 6.

KIF4A was a target of miR-516b in EC cells. (a) Heatmaps. (b) Volcano maps. (c) Veen diagram. (d) Relative levels of KIF4A in GSE17025, GSE63678 and TCGA data. (e) The relative levels of KIF4A across stage1 to 4 of EC were analyzed by UALCAN program. (f) UALCAN program analyzed KIF4A expression across diverse cancer types. (g) qPCR assessed KIF4A levels in 106 EC specimens. (h) qPCR determined KIF4A levels. (i) CCK-8 assays. (j) Colony formation assays. (k) starbase algorithm predicted the potential binding sites between 3ʹUTR of KIF4A mRNA and miR-516b. (l) Luciferase reporter assays. * P < 0.05, **P < 0.01.
