Figure 1.

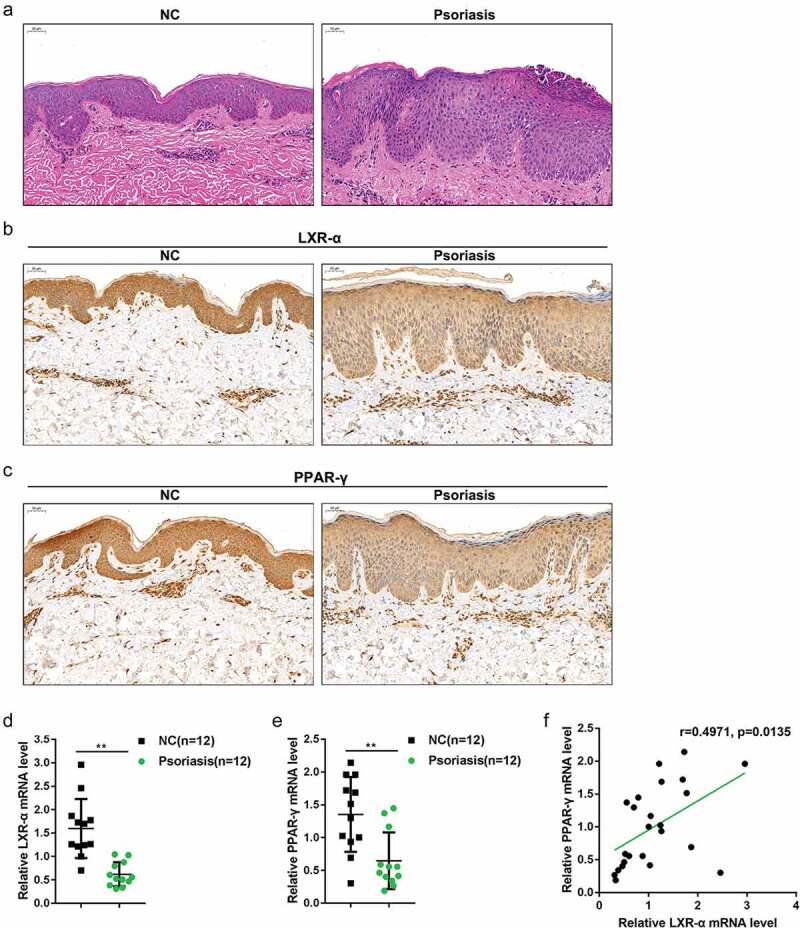
Distribution and protein levels of LXR-α and PPAR-γ in tissue samples (a) Pathological analysis of psoriasis lesion and nonlesion tissues using hematoxylin and eosin (H&E) staining. (b-c) The distribution and protein levels of LXR-α and PPAR-γ in psoriasis lesion and nonlesion tissues determined by immunohistochemical (IHC) staining. (d-e) The mRNA expression of LXR-α and PPAR-γ in psoriasis lesion (n = 12) and nonlesion tissues (n = 12) was determined by real-time PCR. (f) The correlation of LXR-α and PPAR-γ expression. **P < 0.01.
