
Figure 4.
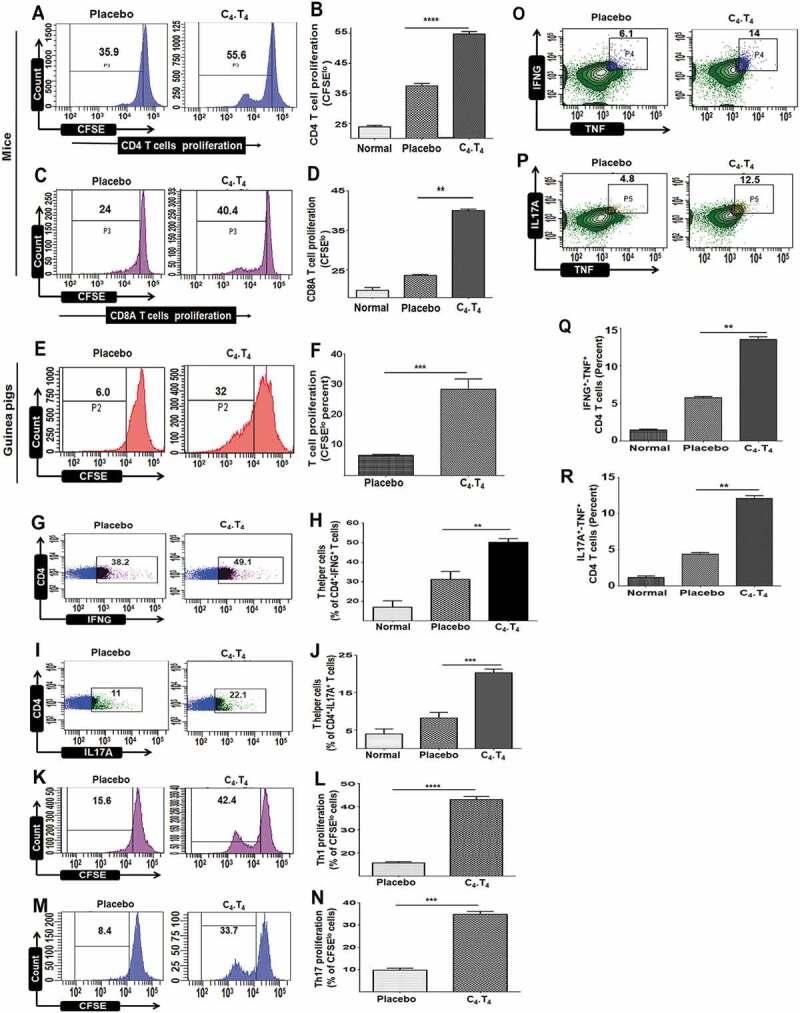
Treatment with C4.T4 augmented the proliferation of T cells and evoked Th1 and Th17 immune responses in Mtb-infected mice and guinea pigs. Mtb-challenged animals were treated with C4.T4. After 45 d, splenocytes were isolated and CFSE labeled. Proliferation of (A,B) CD4 T cells and (C,D) CD8A T cells was examined. (E,F) T cell proliferation of cells isolated from the spleen of guinea pigs. Data in the inset of flow cytometer histograms depicted percentage of CFSElo cells and were correspondingly shown as bar diagrams (B,D,F). Intracellular staining of (G,H) IFNG+ and (I,J) IL17A+ was measured by flow cytometry in CD4 T cells isolated from the lung. The CD4 gated T cells showed intracellular expression of (K,L) IFNG and (M,N) IL17A were examined for proliferation through CFSE-dye dilution assay. The number in the inset of the flow cytometry plots depicted percentage of cells (G,I,K,M). Bar diagrams show pooled data from 2–3 independent experiments (H,J,L,N). (O–R) The cells isolated from lungs were stimulated with C4.T4 for 72 h and intracellular staining was done for (O,Q) IFNG-TNF, (P,R) and IL17A-TNF in CD4 gated polyfunctional T cells. Numbers in the inset of the flow cytometry plots depicted the percentage of cells. The flow cytometry data are also shown as bar diagrams and are pooled data from 2–3 independent experiments (Q,R). Normal, animals not exposed to Mtb; Placebo, animals exposed to Mtb; C4.T4, Mtb-exposed animals treated with C4.T4. Data are mean ± SEM from 2–3 independent experiments (n = 4 mice/group), each performed in triplicate. Data were analyzed by one-way ANOVA repeated measure **p ≤ 0.01, ***p ≤ 0.001, ****p ≤ 0.0001.