
Figure 10.
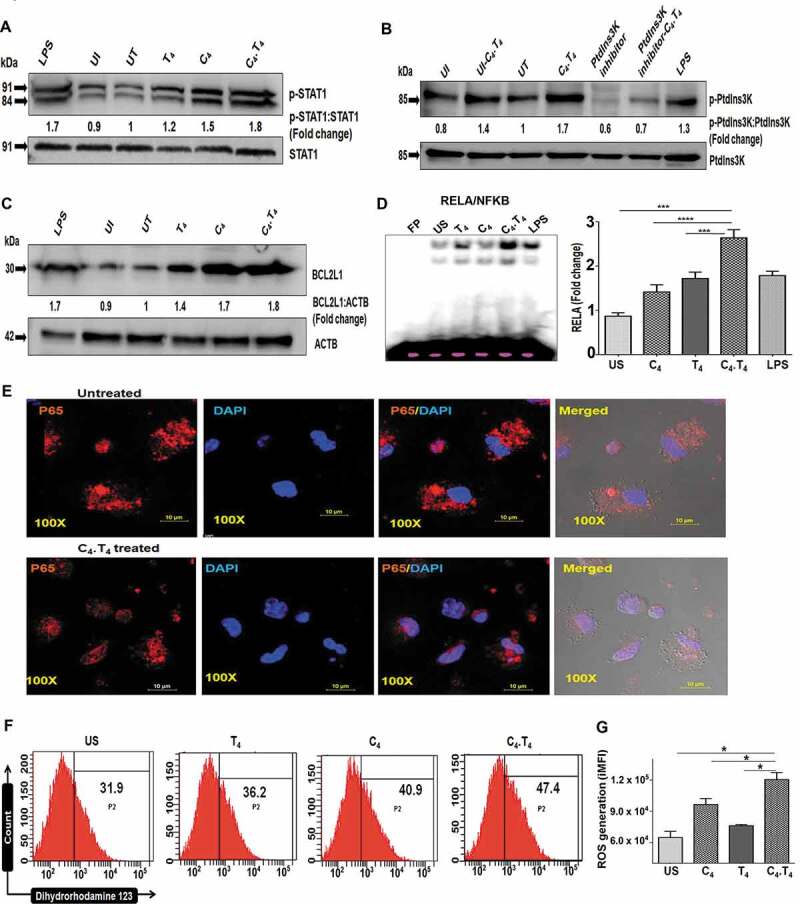
C4.T4 induced phosphorylation of STAT1, PtdIns3K and enhanced nuclear translocation of RELA/NFKB. Macrophages were infected with H37Rv for 4 h and cultured with C4.T4 for 15–30 min and 24 h. The cell lysate was prepared, and western blot was performed to monitor the expression of (A) p-STAT1; (B) p-PtdIns3K; (C) BCL2L1. The densitometry data represent fold change. The ratio for untreated cells was considered to be 1. LPS was used as a positive control. UI, uninfected; UT, untreated and Mtb-infected; C4, CLEC4E agonist (TDB); T4, TLR4 agonist (ultra-pure LPS). The data are representative of 2–3 independent experiments. (D–G) BMDMs were stimulated with C4 (24 µg/ml) and T4 (10 ng/ml) individually or in combination (C4.T4) for 30 min. (D) Nuclear translocation of RELA/NFKB was monitored by EMSA. The data were graphed as fold change in the form of a bar diagram. Unstimulated cells were considered as 1. FP, free probe; US, unstimulated. The data are shown as the mean ± SEM and are from 2 independent experiments. Data were analyzed by one-way ANOVA repeated measure. ***p ≤ 0.001, ****p ≤ 0.0001. (E) Translocation of RELA/NFKB p65 into the nucleus was further monitored by confocal microscopy and (F,G) the generation of ROS was observed by flow cytometry after labeling with dihydrorhodamine 123 dye. (F) The histogram depicted ROS generation (percentage). (G) The bar diagram represented integrated MFI of ROS generation. The data represented in each histogram or contour plot depicted the percentage of cells from the ADGRE1/F4/80 gated population. US, unstimulated; UT, untreated and Mtb-infected; C4, CLEC4E agonist (TDB); T4, TLR4 agonist (ultra-pure LPS). The integrated MFI (iMFI) is calculated by multiplying the relative frequency (% positive population) of cells generating ROS with the mean fluorescence intensity (MFI) of that population. Data are shown as the mean ± SD and are representative of 2–3 independent experiments. Data were analyzed by one-way ANOVA repeated measure. *p ≤ 0.05.