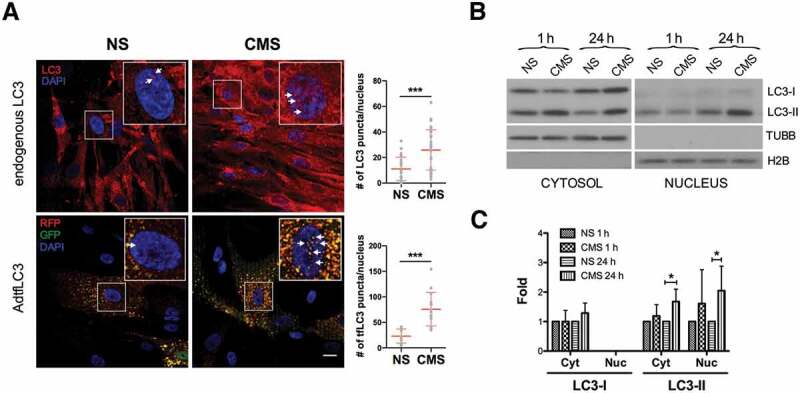
Figure 1.

Increased nuclear LC3-II levels in hTM cells under CMS. (A) Immunocytochemical analysis of endogenous LC3 (upper panels, red color) or tfLC3 fluorescence (lower panels, RFP and GFP signals) in non-stretched (NS) or stretched (CMS, 8% elongation, 24 h) hTM cells. LC3 puncta in the nucleus are indicated by arrows in each inset. Scale bars: 20 μm. Images were acquired with confocal microscopy from 3 independent experiments with different primary cultured hTM cells, processed and LC3 puncta per nucleus were quantified by using Fiji software. Data are shown as the mean ± S.D. (n = 30 and 29 nuclei number for endogenous LC3, and 14 and 13 for tfLC3 in NS vs CMS, respectively). ***, p < 0.001, (two-tailed unpaired Student’s t-test). (B) Protein expression levels of LC3 in cytosolic and nuclear fractions of hTM cells subjected to CMS for 1 or 24 h, evaluated by WB. Band densities were quantified by Image Lab™ touch software and normalized with TUBB and H2B for cytosolic and nuclear fractions, respectively (C). NS: non-stretch control, CMS: cyclic mechanical stretch. Data are shown as the mean ± S.D. (n = 3). *, p < 0.05, (two-tailed unpaired Student’s t-test).
