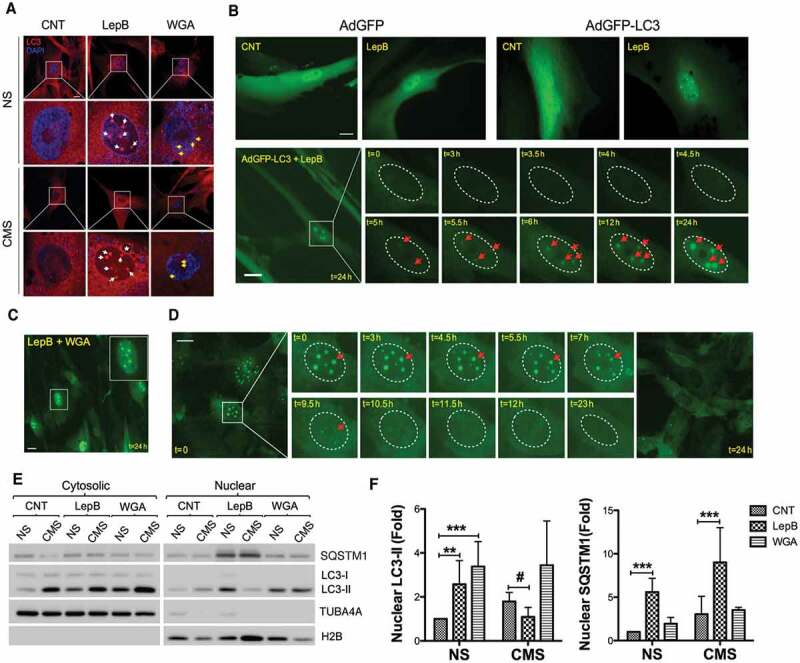
Figure 2.

Nucleocytoplasmic shuttling of LC3 in hTM cells. (A) Representative immunocytochemical analyses of endogenous LC3 in hTM cells subjected to CMS for 24 h in the presence of Lep B (20 nM) or WGA (5 µg/mL). Nuclear LC3 dots resulting from LepB treatment are indicated by white arrows; yellow arrows indicate LC3 puncta formed by CMS. Asterisk indicate perinuclear autophagosome. (B) Time-lapse live cell imaging of AdGFP- or AdGFP-LC3-transduced hTM cells following LepB (20 nM) treatment. Upper panels represent images taken after 24-h treatment. Lower panels showed GFP-LC3 fluorescence chase through the duration of the treatment, using CELENA® S Digital Imaging System. Nucleus is outlined by ellipse with dot line. Each nuclear LC3 dot is indicated by red arrows. (C) Representative image of AdGFP-LC3-transduced cells treated simultaneously with LepB (20 nM) and WGA (5 µg/ml) for 24 h. (D) Time-lapse live cell imaging of GFP-LC3 nuclear dots after LepB removal. GFP-LC3 fluorescent signals were chased for 24 h. Nuclear LC3 dots are indicated by red arrows. (E) Protein levels of LC3-I, LC3-II and SQSTM1 in purified cytosolic and nuclear fractions from hTM cells subjected to CMS (8% elongation, 24 h) in the presence of LepB (20 nM) or WGA (5 µg/mL). Band densities were quantified by Image Lab™ touch software and normalized with H2B for nuclear fractions (F). NS: non-stretch control, CMS: cyclic mechanical stretch. Data are shown as the mean ± S.D. (n = 3). *, p < 0.01; ***, p < 0001, #, p < 0.05 (two-tailed unpaired Student’s t-test). Scale bars: 20 μm. * compares Lep and WGA treatment versus non-treated; # compares CMS versus NS.
