
Figure 5.
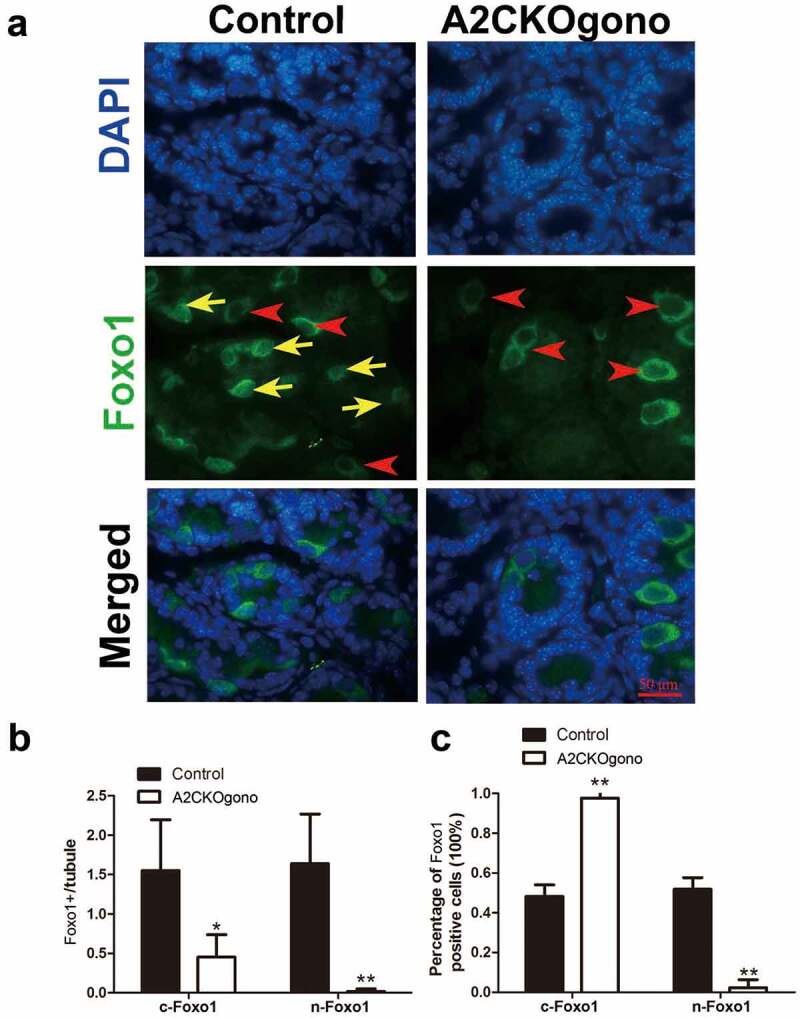
Sub-cellular localization of Foxo1 in A2CKOgono and controls to indicate transition from gonocytes to SSC. (a) Paraffin-embedded testis sections from A2CKOgono and control at pnd 4.5 were stained with anti-Foxo1 antibody. Bar indicates 50 μm. Red arrowheads indicate the cytoplasmic Foxo1-positive cells; yellow arrows indicate nuclear Foxo1-positive cells. (b) Quantitative analysis of nuclear versus cytoplasmic Foxo1-positive cells per tubule and (c) the percentage of nuclear versus cytoplasmic Foxo1-positive cells in A2CKOgono (n = 158 tubules from three mice) and controls (n = 186 tubules from three mice. Data represent Mean ± SEM. *P < 0.05, **P < 0.001.