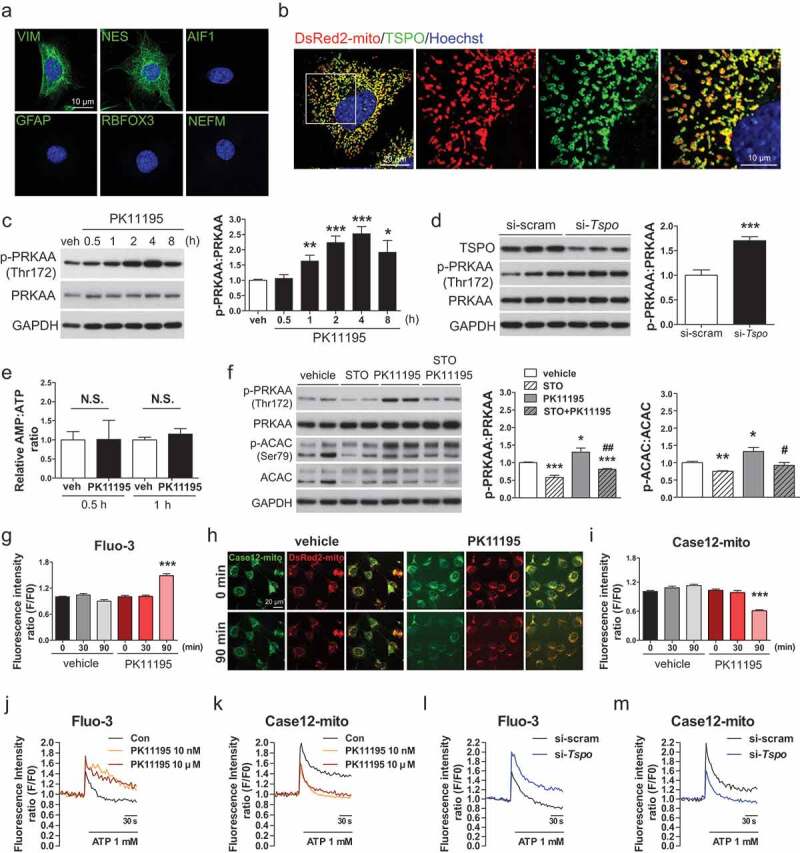
Figure 3.

Inhibition of TSPO activates AMPK by blocking mitochondrial Ca2+ uptake in A2/29 cells. (A) Immunostaining for VIM or NES (green) with Hoechst (blue) staining. No staining was detectable for AIF1, GFAP, RBFOX3, and NEFM (all green). (B) Representative micrographs of DsRed2-mito and immunostaining for TSPO (green) with Hoechst (blue) staining. (C) Immunoblotting analysis and quantification of p-PRKAA in cells treated with vehicle (veh) or 10 μM PK11195 (n = 3). (D) Immunoblotting analysis and quantification of TSPO and p-PRKAA in si-scram- or si-Tspo-transfected cells (n = 8 or 9). (E) AMP:ATP ratio in vehicle- or 10 μM PK11195-treated cells determined by using UPLC (n = 5). All differences were not significant (N.S.). (F) Immunoblotting analysis and quantification of p-PRKAA and p-ACAC in cells treated with vehicle or 10 μM PK11195 for 2 h with or without 4 h pretreatment with STO-609 (STO), a CAMKK inhibitor (n = 4). (G) Time course of fluorescence intensity of Fluo-3/AM [Ca2+]cyto in cells treated with vehicle or 10 μM PK11195 (n = 89–139 cells). (H and I) Representative micrographs (H) and time course analysis (I) of Case12-mito and DsRed2-mito for measurement of [Ca2+]mito in cells treated with vehicle or 10 μM PK11195 (n = 89–141 cells). Case12-mito labeling intensity was normalized to that of DsRed2-mito. (J and K) Live imaging for fluorescence-based detection of [Ca2+]cyto (J) and [Ca2+]mito (K) in response to 1 mM ATP in cells pretreated with vehicle or PK11195 (10 nM or 10 μM) for 90 min (n = 11–15 cells from 3 independent experiments). (L and M) Live imaging for fluorescence-based detection of [Ca2+]cyto (L) and [Ca2+]mito (M) in response to 1 mM ATP in si-scram- or si-Tspo-transfected cells (n = 15 or 16 cells from 3 independent experiments). Data are mean ± SEM, *P ≤ 0.05, **P ≤ 0.01, and ***P ≤ 0.001 vs. si-scram, vehicle (veh), and PK11195 0 min; #P ≤ 0.05, ##P ≤ 0.01 vs. PK11195, as determined by Student’s t-test.
