
Figure 5.
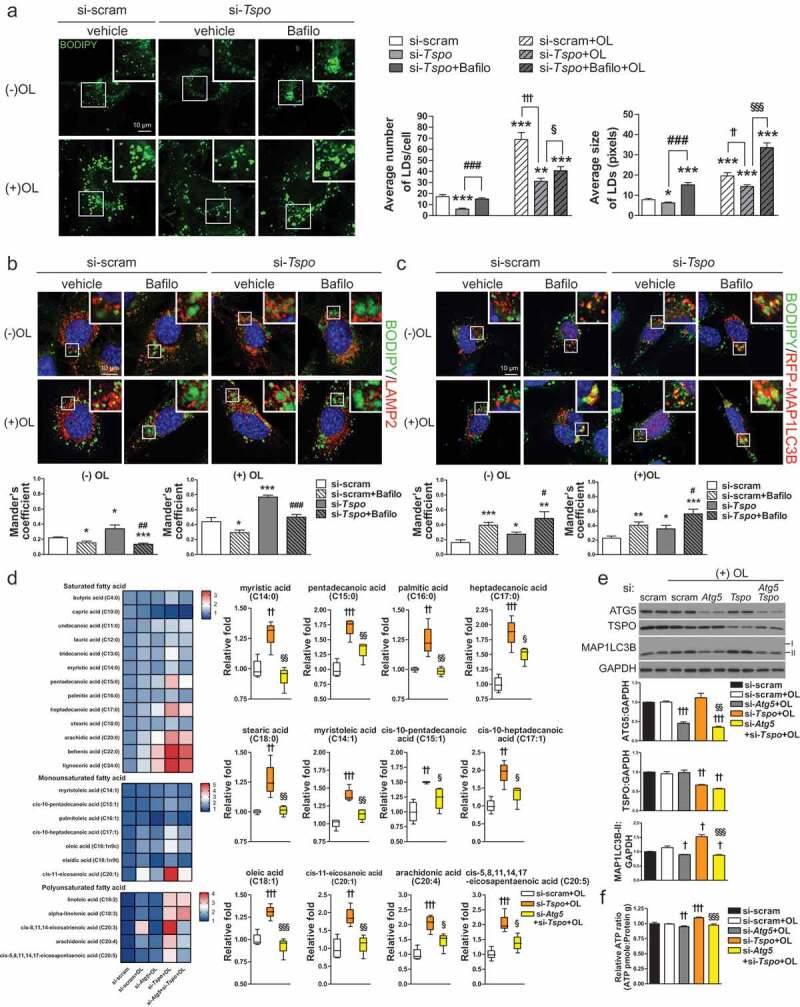
Knockdown of Tspo generates free fatty acids by lipophagy in A2/29 cells. (A) Representative micrographs of BODIPY (green) in si-scram- or si-Tspo-transfected A2/29 cells with or without Bafilo or OL. Average number and size of LDs per cell were quantified (n = 14–21 cells). (B and C) Representative micrographs and quantification of colocalization for BODIPY (green) and LAMP2 (red; B) or mRFP-MAP1LC3B (red; C) in si-scram- or si-Tspo-transfected cells with or without Bafilo and OL (n = 11–16 cells). (D) Heatmap and box–whisker plot of free fatty acids analyzed by targeted GC-MS/MS metabolomics of si-scram- or si-Tspo-transfected cells with OL and with or without pre-transfection with si-Atg5 (n = 4). (E) Immunoblotting analysis and quantification of ATG5, TSPO, and MAP1LC3B-II in si-scram- or si-Tspo-transfected cells with OL and with or without pre-transfection with si-Atg5 (n = 3). (F) Cellular ATP level in si-scram- or si-Tspo-transfected cells with OL and with or without pre-transfection with si-Atg5 (n = 16). Data are mean ± SEM, *P ≤ 0.05, **P ≤ 0.01, ***P ≤ 0.001 vs. si-scram; #P ≤ 0.05, ##P ≤ 0.01, ###P ≤ 0.001 vs. si-Tspo; †P ≤ 0.05, ††P ≤ 0.01, †††P ≤ 0.001 vs. si-scram+OL; §P ≤ 0.05, §§P ≤ 0.01, §§§P ≤ 0.001 vs. si-Tspo+OL, as determined by Student’s t-test.