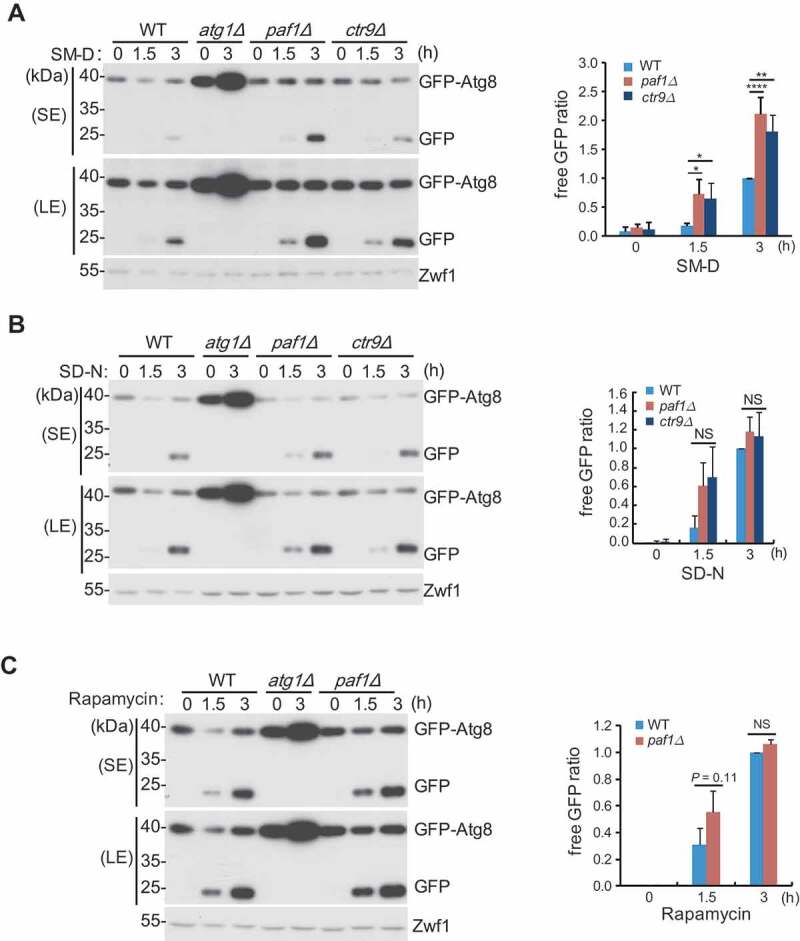
Figure 2.

GFP-Atg8 processing assays were performed using the indicated yeast cells expressing the endogenous promoter-driven GFP-Atg8 construct. Cells were cultured in different starvation conditions: (A) SM-D, glucose starvation; (B) SD-N, nitrogen starvation; (C) rapamycin treatment. Cells were collected at the indicated time points after each treatment. GFP-Atg8 degradation was measured by immunoblotting with anti-GFP antibody (left panel). Relative free GFP levels against the 3-h time point in the WT (set as 1) were statistically quantified (right panel). Zwf1 was used as a loading control.
