Figure 5.

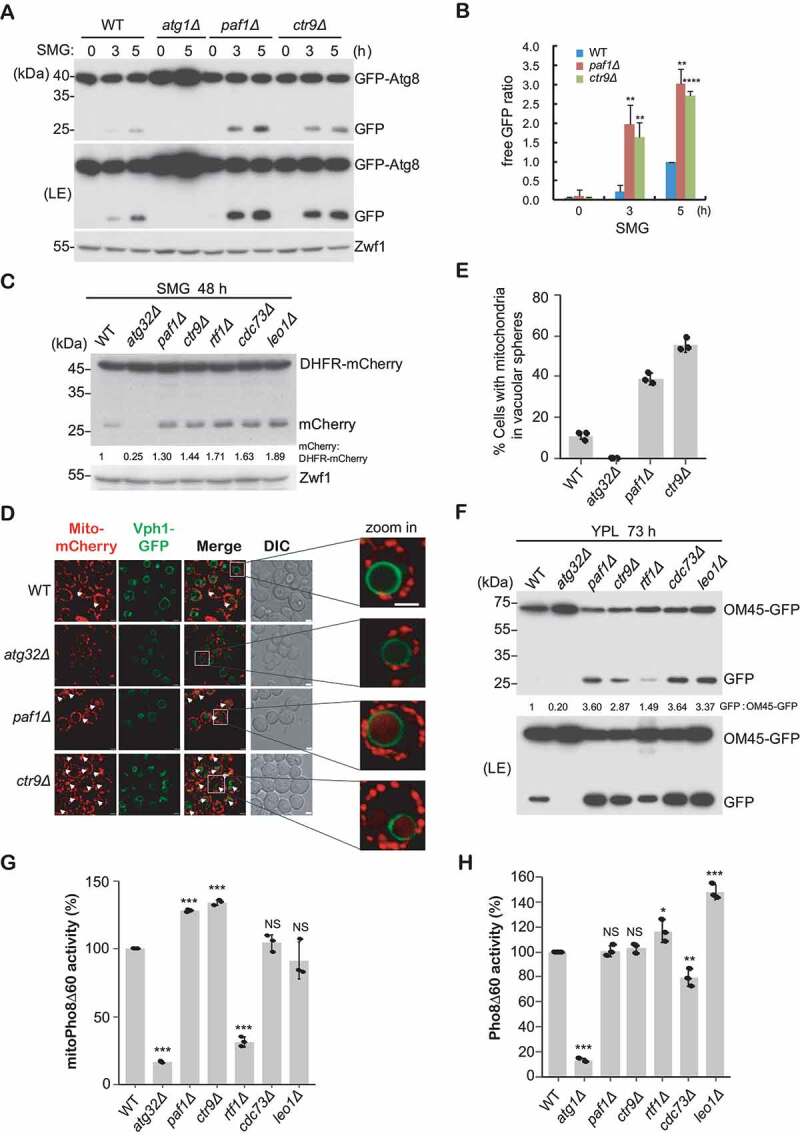
Paf1C negatively regulates mitophagy. (A-B) GFP-Atg8 processing assays were performed as described in Figure 2, except that cells were cultured in SMG medium. Relative free GFP levels against the 5 h time point in the WT strain (set as 1) were statistically quantified (B). (C) The indicated yeast cells bearing integrated mito-DHFR-mCherry were cultured in SMG medium for 48 h. Free mCherry signals were detected by immunoblotting with anti-mCherry antibody. (D-E) The indicated cells with integrated Vph1-GFP and mito-DHFR-mCherry were grown in SMG medium for 36 h. Cell mitophagy patterns were observed using fluorescence microscopy. Arrows highlight vacuolar-localized mitochondria. Representative images were enlarged and shown on the right (D). DIC, differential interference contrast. Scale bar: 2 μm. Cells (n = 100) showing mitochondria (red) surrounded by vacuoles (green) were counted, and cell populations were statistically quantified (E). (F) OM45-GFP-processing assays were performed using the indicated cells expressing integrated OM45-GFP that were cultured in YPL for 73 h. Free GFP indicates the degradation of mitochondria. (G-H) MitoPho8Δ60 activity (G, mitophagy measurement) or Pho8Δ60 activity (H, bulk autophagy measurement) were examined and statistically quantified in the indicated cells. The WT activity was set to 100%, and other strains were normalized to the WT.
