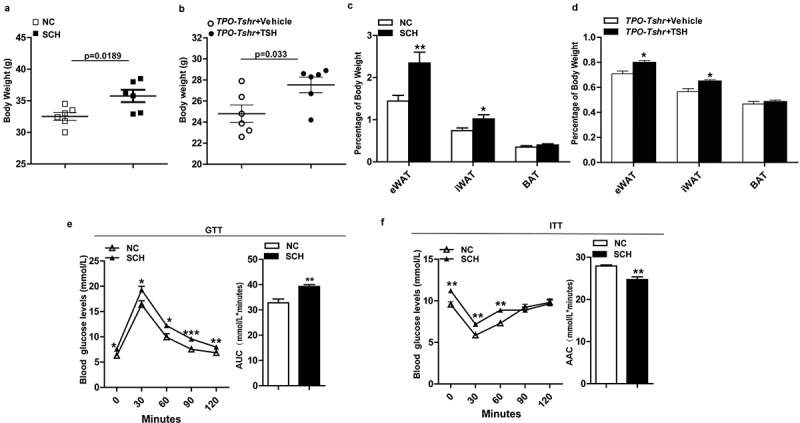
Figure 1.

TSH promotes adiposity and its metabolic consequences. SCH: subclinical hypothyroidism mice; NC: normal control mice; TPO-Tshr: TPO-Cre/Tshrflox/flox mice; WT: wild-type littermates. AUC: area under curve; ACC: area above curve. (a) Body weight of the control and SCH mice (n = 10). (b) Body weight evaluation of the TPO-Tshr mice treated with TSH or vehicle for 2 weeks (n = 6). (c) Weight of eWAT, iWAT and BAT normalized to the body weights of the control and SCH mice (n = 8). (d) Weight of eWAT, iWAT and BAT normalized to the body weights of TPO-Tshr mice injected with TSH or vehicle (n = 6). (e, f) Results of the OGTT (f) and ITT (g) in the control and SCH mice (n = 8). The values represent the means ± s.e.m. Error bars represent s.e.m. Significant differences in SCH compared with NC mice and TPO-Tshr mice treated with TSH compared with vehicle controls are indicated by *P < 0.05, **P < 0.01 and ***P < 0.001 (Student’s t-test or 2-way ANOVA with repeated measures and Bonferroni post-hoc tests)
