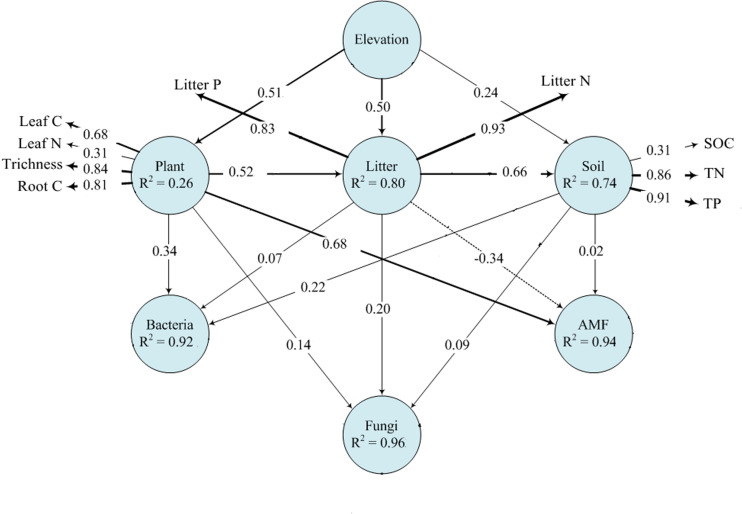
FIGURE 5.
Effects of elevation on microbial communities by plant and soil properties based on PLS-PM analysis. The width of arrows is proportional to the strength of path coefficients. Continuous and dashed arrows indicate positive and negative relationships, respectively. R2 denotes the proportion of variance explained.

