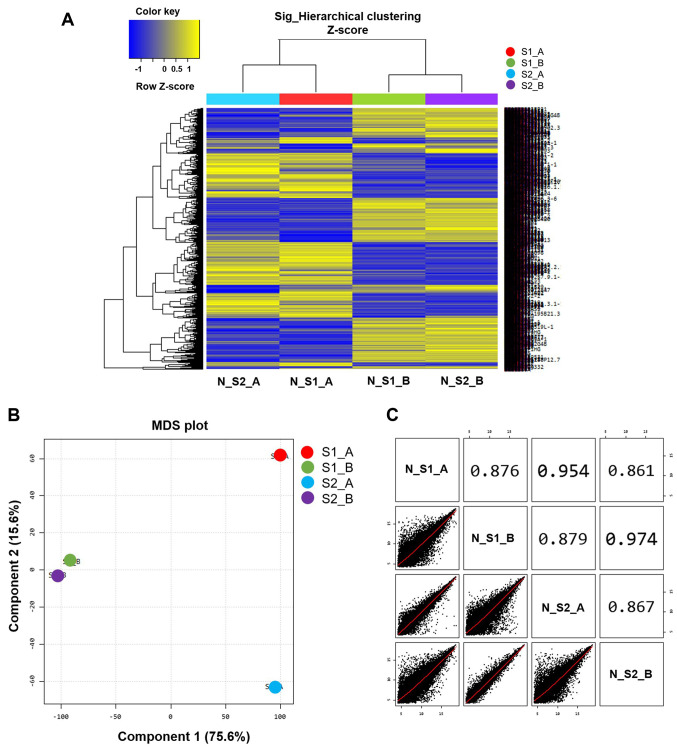
Figure 2.
Gene expression microarray analysis. (A) Heat map analysis of differential gene expression profiles amongst the 4 samples tested. The rows display genes and the columns show the different samples. (B) Degree of similarity amongst the 4 samples was tested, and determined using an MDS plot. Component 1 and 2 are 22,628 normalized and filtered cellular genes expressed in each sample. (C) Scatter plot between 2 samples; the correlation was analyzed. MDS, Multidimensional scaling plot. EBV, Epstein-Barr virus; BLCL, B-lymphoblastoid cell lines; normal B cells, S1_A and S2_A; EBV-transformed BLCL, S1_B and S2_B.

