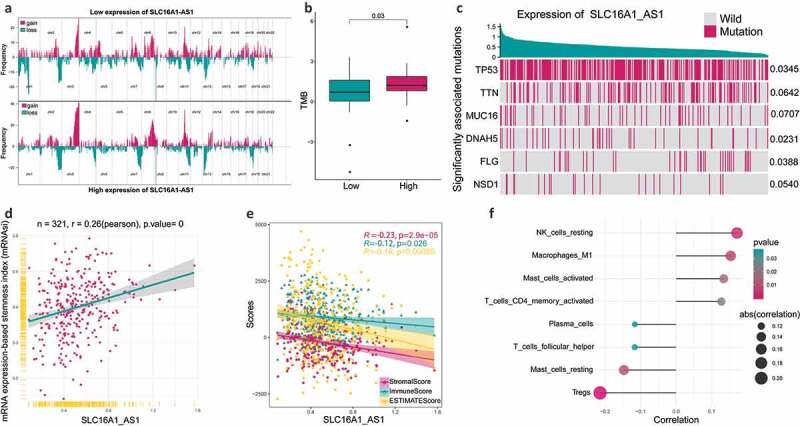
Figure 3.

The relationship between SLC16A1-AS1 and tumorigenesis-related features.
(a) Composite copy number profiles for low and high SLC16A1-AS1 expression by GISTIC 2.0 amplifications and deletions in OSCC. Chromosomal locations of peaks of significantly recurring focal amplification (red) and deletions (blue) were presented. (b) TMB in patients with low SLC16A1-AS1 expression and high SLC16A1-AS1 expression. (c) Associations between expression of SLC16A1-AS1 and gene mutation statue. The top six significantly related genes were presented. (d) Correlation between mRNA expression-based stemness index (mRNAsi) and SLC16A1-AS1 expression. (e) Correlation of stromal-score, immune-score and ESTIMATE-score with SLC16A1-AS1 expression. (f) SLC16A1-AS1 expression is significantly related to several infiltrating immune cells.
