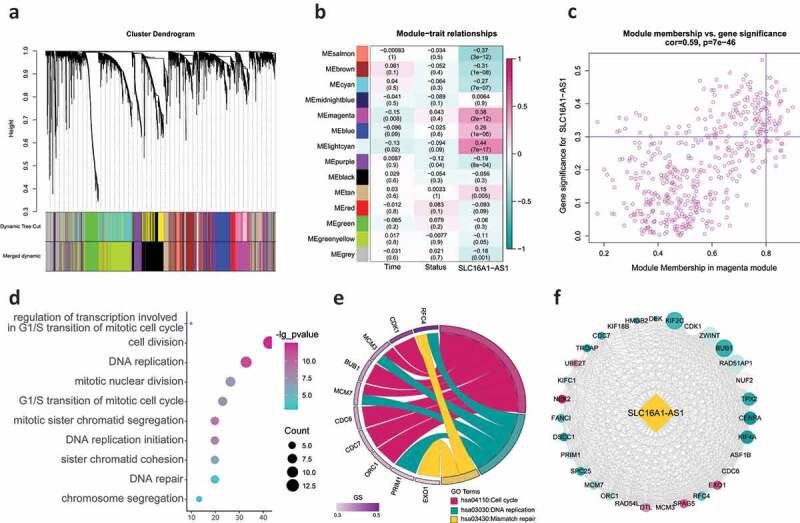
Figure 4.

WGCNA identifying the key regulating module and biological functions SLC16A1-AS1 involved in.
(a) Hierarchical clustering dendrogram of genes with dissimilarity based on topological overlap. Modules are the branches of the clustering tree and there were 14 modules identified. (b) Correlation between module eigengenes and SLC16A1-AS1 expression. Each row corresponds to a module eigengene and columns represent a concerning feature. Each cell contains the correlation coefficient and P-value, and magenta module was second most correlated with SLC16A1-AS1. (c) Scatter plot of genes in magenta module. The vertical line represents cutoff of module membership = 0 · 8, and the horizontal line represents cutoff of gene significances for SLC16A1-AS1 = 0.3. The genes met requirements are regarded as SLC16A1-AS1 related key genes. (d) The GO enrichment analysis revealed SLC16A1-AS1 related key genes were involved in multiple aspects of cell proliferation regulation. (e) KEGG pathway analysis revealed SLC16A1-AS1 related key genes are enriched in cell proliferation regulating pathways. (f) PPI network revealed the relationship among these keys genes. The red means a higher MM value and size means the degree in the network.
