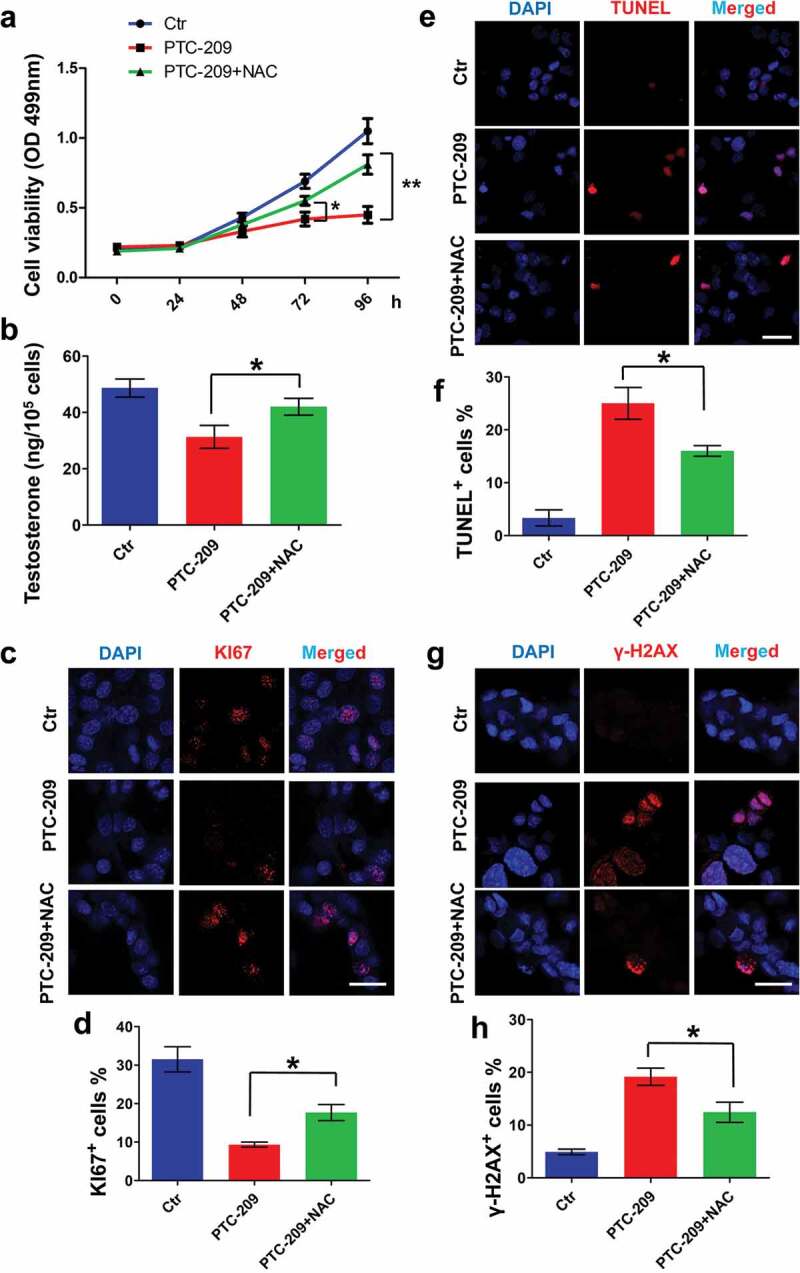
Figure 6.

Effects of NAC in PTC-209-treated primary mouse Leydig cells. (a) MTT assay in primary mouse Leydig cells treated with DMSO (Ctr), 10 μM PTC-209 and 500 μM NAC for the indicated time points. Sample number = 6. (b) Testosterone levels in primary mouse Leydig cells treated with DMSO, 10 μM PTC-209 and 500 μM NAC for 96 h. Sample number = 6. (c) Immunostaining of KI67 in primary mouse Leydig cells treated with DMSO, 10 μM PTC-209 and 500 μM NAC for 96 h. (d) Quantification of c. Sample number = 3. (e) TUNEL assay for primary mouse Leydig cells treated with DMSO, 10 μM PTC-209 and 500 μM NAC for 96 h. (f) Quantification of e. Sample number = 3. (g) Immunostaining of γ-H2AX in primary mouse Leydig cells treated with DMSO, 10 μM PTC-209 and 500 μM NAC for 96 h. (h) Quantification of g. Sample number = 3. Scale bar: 20 μm. * p < 0.05; **p < 0.01, one-way ANOVA.
