
Figure 6.
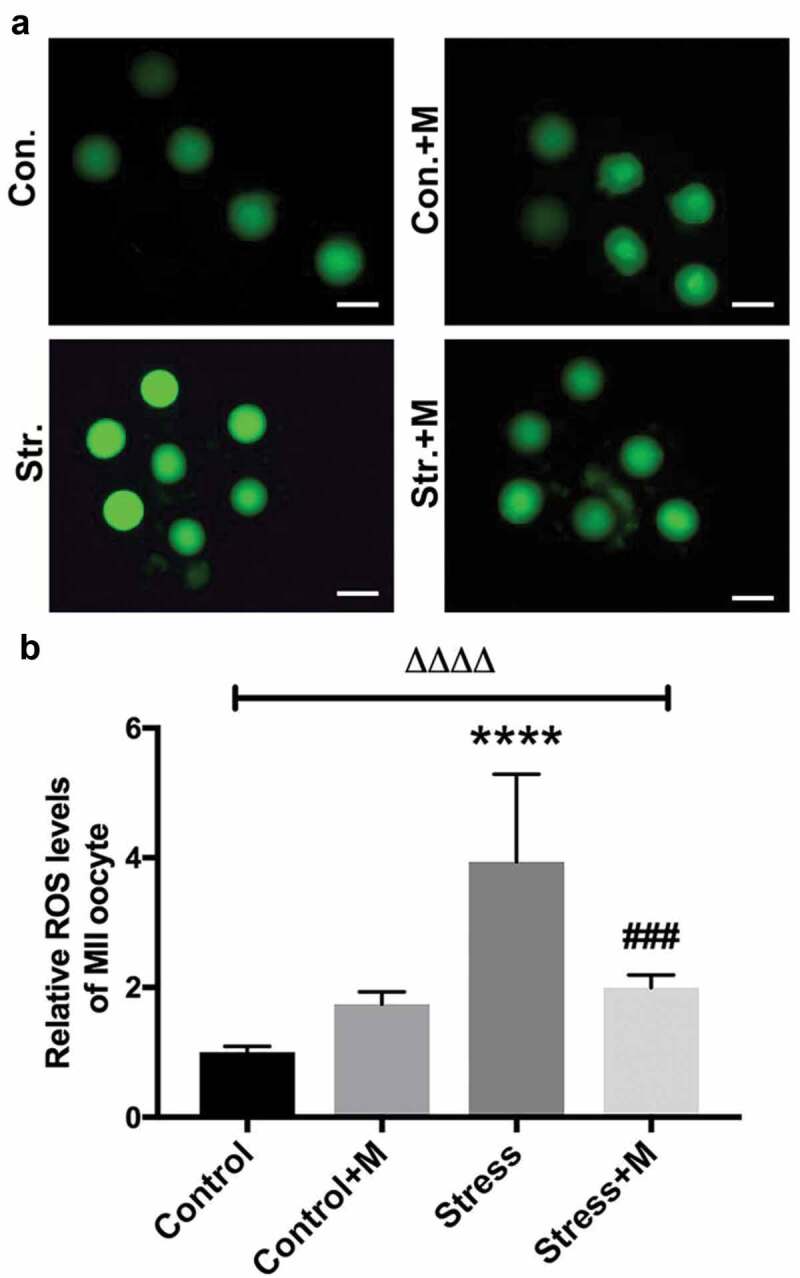
Effects of melatonin (m) and restraint stress on ROS level in MII oocytes. (a) Live oocytes were assessed for ROS, visualized as green fluorescence from control (Con.), control+M (Con.+M), stress (Str.) and stress+M (Str.+D) mice. (Bar = 100 μm). (b) ROS levels were quantified as the sum total of green fluorescence within each oocyte (n = 50 oocytes from five mice per group). All data are presented as mean ± SEM. ΔΔΔΔP < 0.0001 ANOVA; ****P < 0.0001 vs. control group; ###P < 0.001 vs. stress group. Control, non-stress treated with vehicle; Control+M, non-stress treated with melatonin; Stress, stress treated with vehicle; Stress+M, stress treated with melatonin.