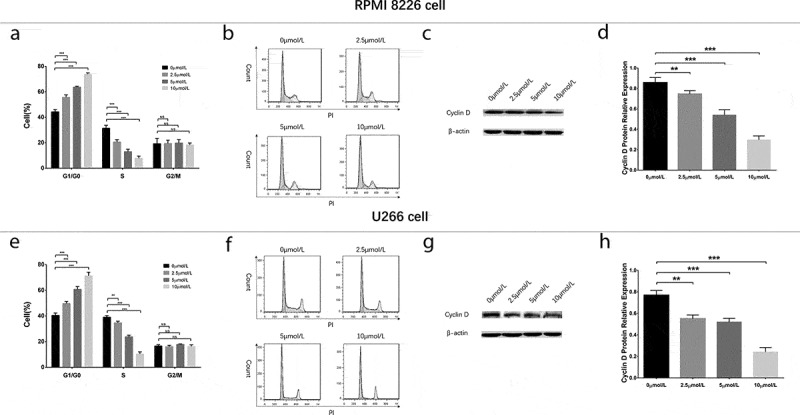
Figure 4.

Cell cycle analysis in MM cells treated by different concentrations of GANT61. Statistical graph of cell cycle analysis after treated by various concentrations (0, 2.5, 5, 10 μmol/L) of GANT61 at 24 h in RPMI-8226 cells (a). Cell cycle analysis by flow cytometer after treated by various concentrations (0, 2.5, 5, 10 μmol/L) of GANT61 at 24 h in RPMI-8226 cells (b). Expression of Cyclin D after treated by various concentrations (0, 2.5, 5, 10 μmol/L) of GANT61 at 24 h in RPMI-8226 cells (c, d). Statistical graph of cell cycle analysis after treated by various concentrations (0, 2.5, 5, 10 μmol/L) of GANT61 at 24 h in U266 cells (e). Cell cycle analysis by flow cytometer after treated by various concentrations (0, 2.5, 5, 10 μmol/L) of GANT61 at 24 h in U266 cells (f). Expression of Cyclin D after treated by various concentrations (0, 2.5, 5, 10 μmol/L) of GANT61 at 24 h in U266 cells (g, h). Comparison between two groups was determined by t-test. P value < 0.05 was considered significant. **P < 0.01; ***P < 0.001; NS, no significance; MM, multiple myeloma.
