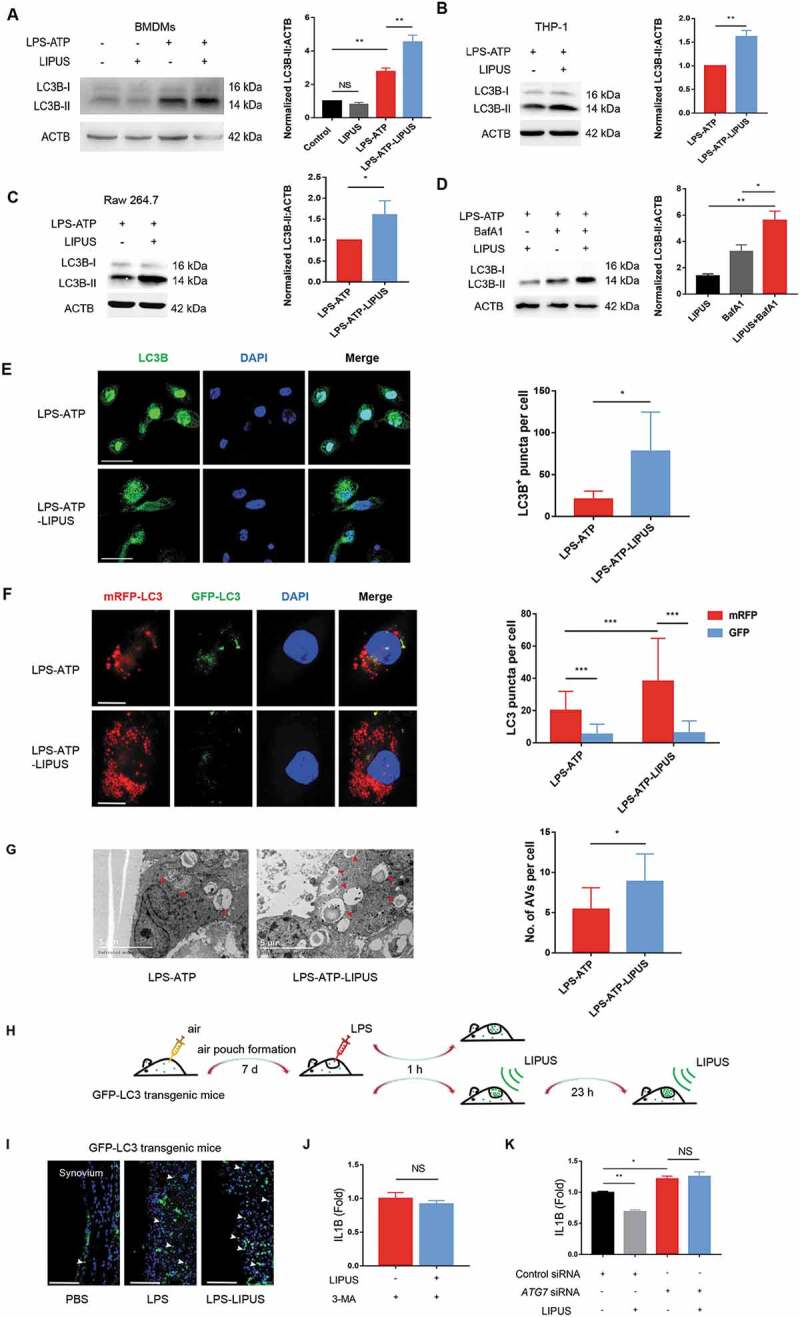
Figure 4.

The enhanced autophagy contributes to LIPUS-mediated inhibition on the production of mature IL1B in LPS-ATP treated macrophages. BMDMs (A), THP-1 cells (B) and Raw 264.7 cells (C) with the indicated treatments were subjected to western blot assay using anti-LC3B antibody and anti-ACTB antibody. Statistical analysis (A) was performed using two-way ANOVA followed by Bonferroni’s multiple comparisons test. NS, not significant, **p < 0.01. Statistical analyses (B and C) were performed using Student’s t test. *p < 0.05, **p < 0.01. (D) THP-1 cells were treated by LPS-ATP in the absence of 100 mM BafA1 with or without LIPUS at the same time. 3 h later, the protein level of LC3B was analyzed by western blot. Statistical analysis was performed using two-way ANOVA followed by Bonferroni’s multiple comparisons test. *p < 0.05, **p < 0.01. (E) THP-1 cells with the indicated treatments were stained with anti-LC3B (green) and DAPI (blue). The numbers of LC3 puncta were counted in six different arbitrary areas (the right panel). Scale bars: 50 μm. Statistical analyses were performed using Student’s t test. * p < 0.05. (F) Confocal images of THP-1 cells stably expressing mRFP-GFP-LC3. Scale bars: 20 μm. 40 cells from each group were counted (the right panel). Statistical analysis was performed using two-way ANOVA followed by Bonferroni’s multiple comparisons test. ***p < 0.001. (G) TEM was used for detection of autophagic vacuoles formation in THP-1 cells with LPS-ATP or LPS-ATP-LIPUS treatment. Red arrowhead indicates an AV (autophagic vacuole). The right panel is the quantification of number of AVs per cell. The number of AVs was counted in nine different arbitrary areas. Scale bars: 5 μm. Statistical analyses were performed using Student’s t test. *p < 0.05. (H and I) LPS-induced air pouch model of synovitis was generated in GFP-LC3 transgenic mice. After LPS injection, the mice were treated with LIPUS twice. 24 h later, the synovium-like tissue in skin was prepared for fluorescent microscopy. Nuclei were stained by DAPI (blue fluorescence). The white arrows represent GFP-positive cells. Scale bar: 100 μm. (J) LPS-ATP-treated THP-1 cells were treated with 3-MA (2 mM) in the presence or absence of LIPUS treatment and subsequently IL1B levels were measured. Statistical analysis was performed using Student’s t test. NS, not significant. (K) THP-1 cells were transfected with ATG7 siRNA (1) to knock down ATG7 for 24 h and then given the treatments indicated. The level of IL1B in supernatants was detected by ELISA. Statistical analysis was performed using two-way ANOVA followed by Bonferroni’s multiple comparisons test. NS, not significant, *p < 0.05, **p < 0.01.
