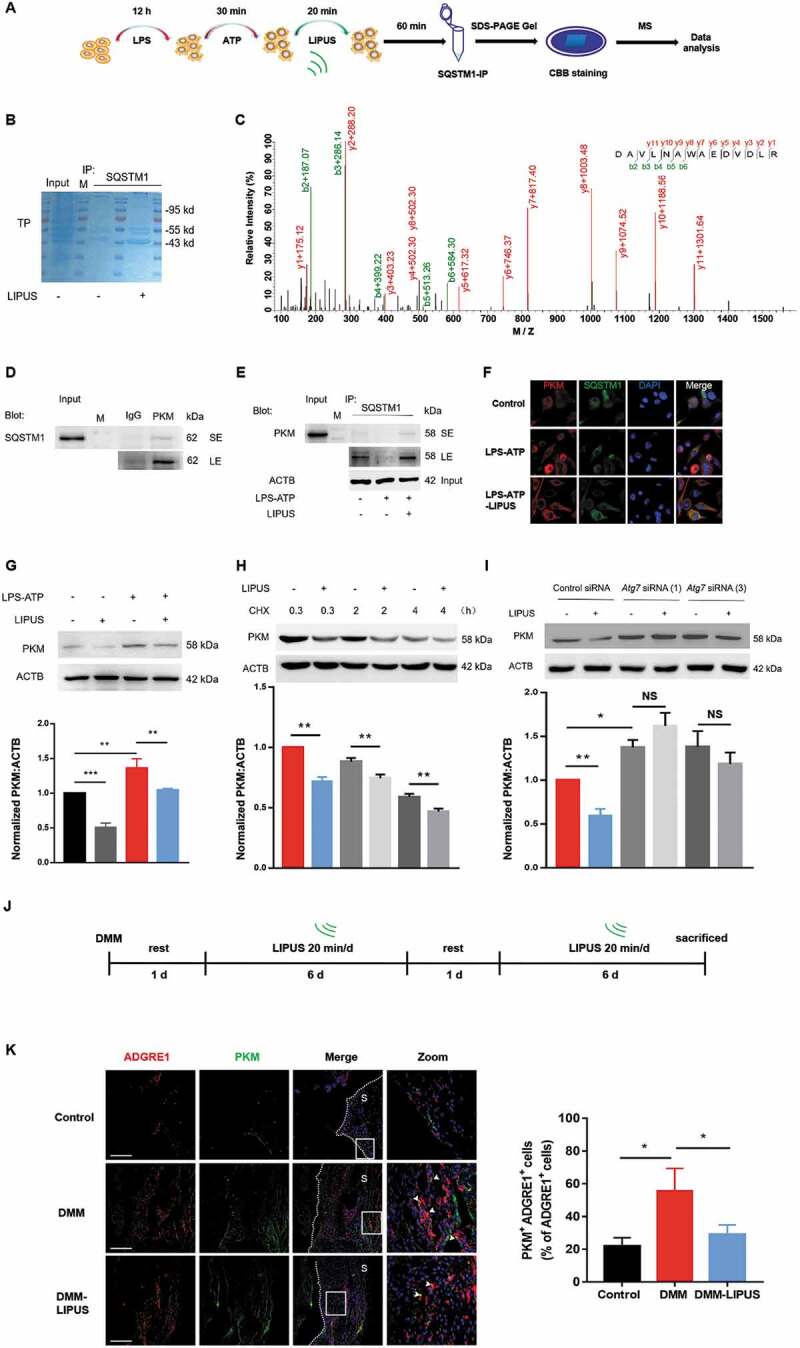
Figure 7.

LIPUS accelerates the formation of SQSTM1-PKM complex and promotes the degradation of PKM in an autophagy-dependent way. (A) THP-1 cells were stimulated with LPS for 12 h and ATP for 30 min. Then, the cells were treated with or without LIPUS for 20 min. Sixty min later, the cells were harvested for immunoprecipitation (IP) with SQSTM1. Then, the immunoprecipitates were subjected to SDS-PAGE gel and stained with Coomassie Brilliant Blue (CBB). Subsequently, the gel was cut and subjected to mass spectrometry analysis. (B) CBB staining for SQSTM1-immunoprecipitates in SDS-PAGE gel. (C) The mass spectrum of peptides for PKM is shown. (D) THP-1 cell lysates were immunoprecipitated with anti-PKM antibodies and subsequently immunoblotted with anti-SQSTM1 antibodies. (E) THP-1 cells were exposed to LPS for 12 h and ATP for 30 min. Subsequently, LIPUS treated cells for 20 min. Sixty min later, whole cell lysates were collected for immunoprecipitation with anti-SQSTM1 antibody and immunoblotted with anti-PKM antibody. (F) Immunostaining detection for PKM (red) and SQSTM1 (green) in LPS-ATP or LPS-ATP-LIPUS-treated THP-1 cells. Scale bars: 20 μm. (G) After THP-1 cells were treated with or without LPS-ATP and LIPUS, the lysates were obtained for western blotting assays with anti-PKM antibodies. Statistical analysis was performed using two-way ANOVA followed by Bonferroni’s multiple comparisons test. NS, not significant, **p < 0.01, ***p < 0.001. (H) The LPS-ATP-treated cells were treated with 5 μM CHX combined with or without LIPUS at indicated intervals. PKM expression was analyzed by western blotting. Statistical analyses were performed using Student’s t test. **p < 0.01. (I) ATG7 siRNA (1) and (3) were transfected into THP-1 cells for 24 h to knockdown ATG7 and then the cells were treated with LPS-ATP followed with or without LIPUS. PKM level was examined by immunoblotting. Statistical analyses were performed using Student’s t test. NS, not significant, *p < 0.05, **p < 0.01. (J) Illustration of the procedure of LIPUS treatment in DMM model. (K) The sections from right knee joint of mice were immunostained with anti-ADGRE1 (red) and anti-PKM (green) antibodies. Nuclei were stained by DAPI (blue). The white arrows refer to PKM+ macrophages. Scale bars: Scale bars: 200 μm. The percentage of PKM-positive macrophages in total ADGRE1-positive macrophages in air pouch wall is presented in right panel. Statistical analyses were performed using two-way ANOVA followed by Bonferroni’s multiple comparisons test. *p < 0.05. The dotted lines represent the boundary of synovium. TP, total protein, M, marker, S, synovium.
