
Figure 2.
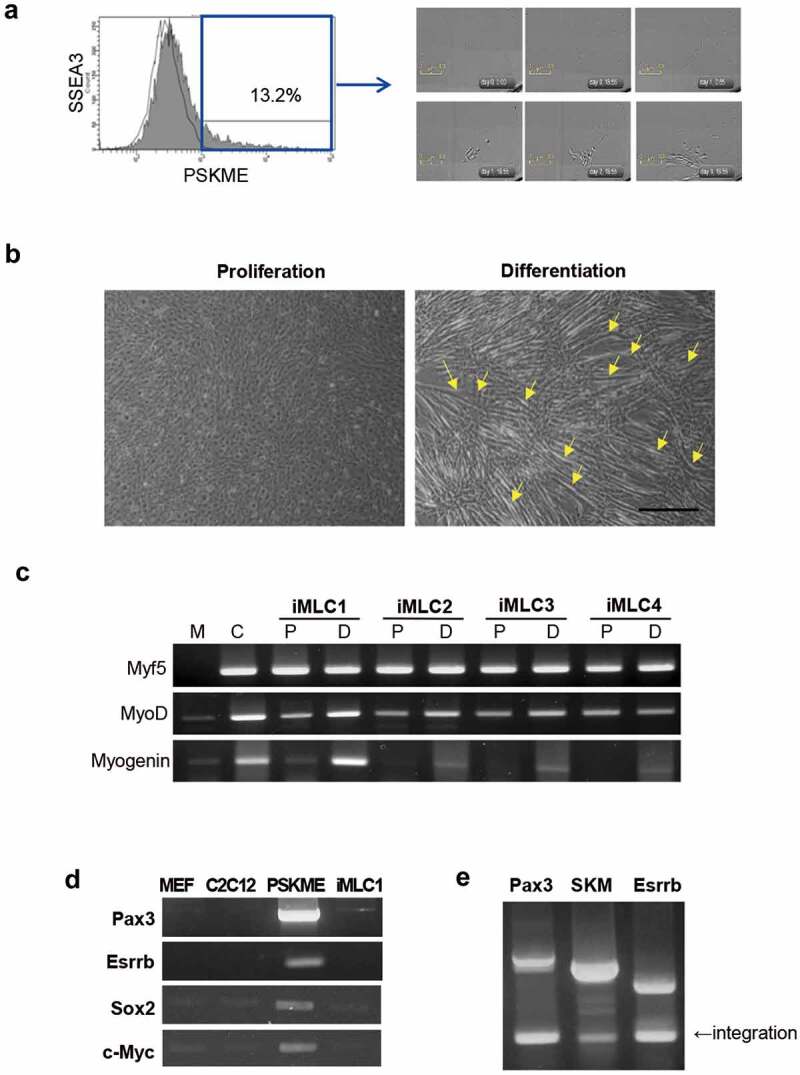
Clonal selection of PSKME cells and identification of iMLCs. (a) Representative images of sorted-single cells from SSEA3 positive PSKME cells (Blue line). The each single SSEA3 cell is plated on 96 well plate. (b) Phase-contrast images of single cells incubated in proliferation or myogenic differentiation media. Arrows indicate differentiated myofibers. Scale bar = 100 µm. (c) RT-PCR of myogenic-related genes of iMLCs incubated in proliferation or differentiation media. M, MEF; C, C2 C12; P, proliferation media; D, differentiation media. (d) Transgene silencing analysis. The PSKME expresses all the induced transcription factors. However iMLC show silencing of transduced genes. (e) Integration test. All the transgenes are integrated. SKM, Sox2, Klf4 and Esrrb.