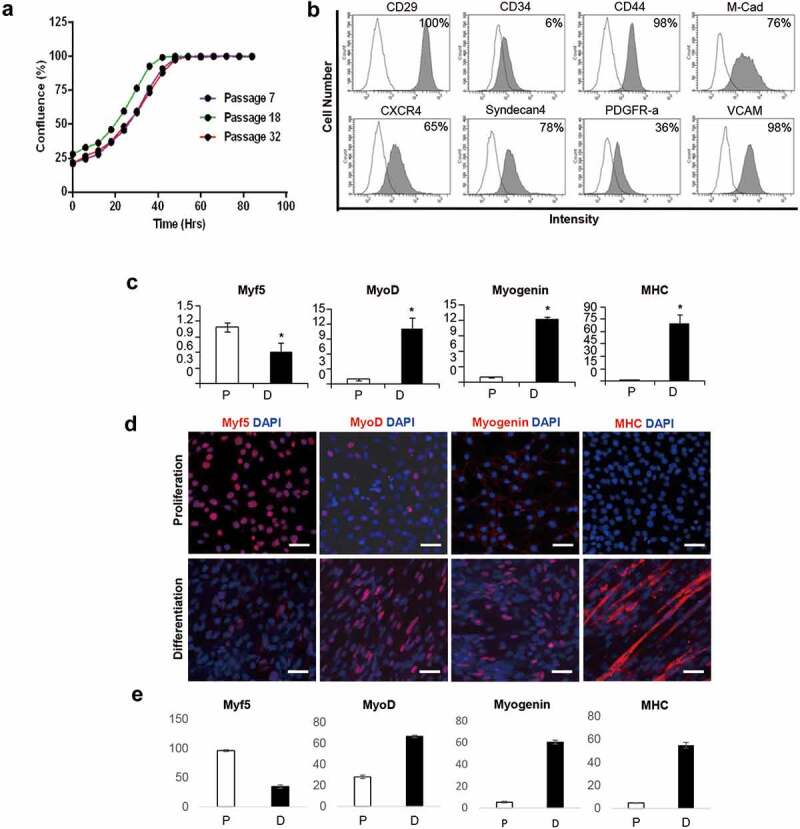
Figure 3.

Characterization of iMLC. (a) Growth curve of iMLC according to passage. (b) Representative FACS profile of iMLC at passage 7. The white area indicates isotype control. The gray area indicate the percentage of positive cells against each cell surface antigens in iMLC. (c) qRT-PCR analysis of myogenic transcription factors of iMLC in proliferation (white bar) and differentiation (black bar) media. Error bars represent SEM from three replicates of three independent experiments. *p < 0.01. P, proliferating media; D, differentiation media. (d) Representative images of immunofluorescence staining of iMLCs. Scale bar = 250 µm. (e) The number of positive cells in immunofluorescence staining of i MLCs. The bar indicates the number of positive cells against each myogenesis markers per total cell number. Error bars represent SEM from three replicates of three independent experiments. P, proliferating media; D, differentiation media.
